. 2010 Dec;131(4):556-69.
doi: 10.1111/j.1365-2567.2010.03328.x. Epub 2010 Aug 16.

The roles of antigen-specificity, responsiveness to transforming growth factor-β and antigen-presenting cell subsets in tumour-induced expansion of regulatory T cells

Affiliations

The roles of antigen-specificity, responsiveness to transforming growth factor-β and antigen-presenting cell subsets in tumour-induced expansion of regulatory T cells

David Coe et al. Immunology. 2010 Dec.

Abstract

In this study we investigated the impact of several factors on the expansion of natural regulatory T (nTreg) cells by tumours, including antigen specificity, transforming growth factor-β (TGF-β) signalling and the antigen-presenting cell subsets responsible for expansion. We found that antigen non-specific expansion of nTreg cells is tumour cell line-dependent. Although both antigen-specific and non-specific pathways can contribute to expansion, the migration of activated nTreg cells to tumour tissues is strictly antigen-dependent. Intact TGF-β signalling on nTreg cells is also essential for tumour-induced expansion. Finally, for stimulation of resting antigen-specific CD4 T cells, CD11c(+) cells purified from tumour-draining lymph nodes were more potent than CD11b(+) cells, suggesting that dendritic cells are the key antigen-presenting cell subset involved in cross-presentation of tumour antigens. This study not only provides an in vivo system in which cross-talk between nTreg cells and tumours can be explored but also reveals novel aspects of tumour immune evasion.


Figures

Figure 1
Figure 1
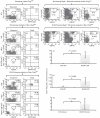
Comparison of anti-MB49 responses by CD25-depleted and CD25-intact Marilyn CD4 T cells. Four groups of Thy-1.2 B6 females (three or four mice/group) were adoptively transferred with 1.5 × 10⁶ CFSE-labelled CD25-depleted- (a, b) or CD25-intact Thy-1.1 Marilyn CD4 T cells (c, d) by intravenous injection. Next day two groups of mice only were inoculated subcutaneously with 0.5 × 106 MB49 cells (a, c). Five days after MB49 inoculation, all groups were analysed by staining of dLN and MB49 (a, c) or pLN (b, d) cells with anti-Vβ6PE, anti-Thy-1.1PerCP and anti-CD4APC. The donor cells in lymph nodes (LN) and MB49 were identified by co-expression of Thy-1.1 and CD4. In addition, LN samples were also stained with anti-Vβ6PE, anti-Thy-1.1PerCP and anti-CD44APC. The donor cells were identified by co-expression of Thy-1.1 and Vβ6 and their CFSE profiles were presented as CFSE versus CD44. A total of 2 million events (no gate) was acquired for each sample. For MB49 samples, tumour size is also indicated. One representative experiment of three is shown.
Figure 2
Figure 2
MB49 expands Marilyn but not B6 natural regulatory T (nTreg) cells in vivo. Four groups of Thy-1.2 B6 females (three mice/group) were transferred with 105 Thy-1.1 Marilyn nTreg (a, b) or Thy-1.1 B6 nTreg cells (c, d), of which two groups of mice were given MB49 cells the next day (b, e) but the other two groups were not (a, d). 11 days after MB49 inoculation, analysis was performed by staining the cells with anti-Vβ6PE or anti-TCR-βPE, anti-Thy-1.1PerCP and anti-CD4APC, before intracellular staining with anti-Foxp3FITC. The donor cells were identified by co-expression of Thy-1.1 and CD4 (R2), and their Foxp3 expression was presented as CD4 versus Foxp3. The absolute numbers of donor cells in various tissues [peripheral (pLN), draining (dLN) and non-draining (ndLN) lymph nodes] were calculated by total cell number ×% of gated lymphocytes (R1) ×% of donor cells (R2)(c, f). One representative experiment of four is shown. A total of 2 million events was acquired for each sample. For the MB49 samples, tumour size is also indicated.
Figure 3
Figure 3
Characterization of HY-expressing B16 cell line (B16/HY). (a) B16, B16/HY and MB49 cells were compared for Dby expression by reverse transcription–polymerase chain reaction (RT-PCR) with male or female B6 spleen cells were used as internal controls. One representative experiment of three is shown. (b) Two groups of B6 females (three mice/group) were inoculated subcutaneously (s.c.) with 5 × 10⁵ B16 or B16/HY cells, respectively. Two weeks later, B16 and B16/HY tumours from individual mice were compared for Dby expression by RT-PCR with B16 and MB49 cell lines were used as internal controls. One representative experiment of two is shown. (c–e) Three groups of Thy-1.2 B6 females (three mice/group) were adoptively transferred with 3 × 10⁶ CFSE-labelled Thy-1.1 Marilyn CD4 T cells. Next day the mice in two groups (d, e) were inoculated s.c. with 5 × 10⁵ B16 or B16/HY cells, respectively. Thirteen days after tumour inoculation, analysis was conducted by staining the cells from various tissues with anti-Vβ6PE, anti-Thy-1.1PerCP and anti-CD4APC. The donor cells were identified by co-expression of Thy-1.1 and CD4 (R2). The CFSE dilution by donor cells is presented as CFSE versus CD4. One representative experiment of two is shown. A total of 2 million events was acquired for each sample. For the B16 and B16/HY samples, tumour size is also indicated.
Figure 4
Figure 4
Comparison of the relative contribution by non-specific and antigen-specific natural regulatory T (nTreg) cell expansion. (a–n) Three groups of Thy-1.2 B6 females (three mice/group) were adoptively transferred with 105 Thy-1.1 Marilyn nTreg cells co-expressing Foxp3/GFP (Mar-nTregGFP) by intravenous injection, of which two groups of mice were subcutaneously (s.c.) inoculated with B16 cells (c–h) or B16/HY cells (i–n) (5 × 10⁵) next day. Eleven days after tumour inoculation, analysis was performed by staining of the cells from various tissues with anti-Vβ6PE, anti-Thy-1.1PerCP and anti-CD4APC. The donor cells were identified by co-expression of Thy-1.1 and Vβ6 (R2) and their Foxp3 expression was presented as Vβ6 versus GFP. One representative experiment of two is shown. A total of 2 million events was acquired for each sample. For the B16 and B16/HY samples, tumour size is also indicated. (o–t) Two groups of Rag2−/− B6 females (four mice/group) were transferred with 2 × 10⁴ Thy-1.2 Marilyn green Treg cells and were also inoculated s.c. with either 1 × 10⁵ B16 (o–q) or B16/HY cells (r–t) on the same day. After 12 days, analysis was performed by staining the draining lymph nodes (dLN; o, r), spleen (p, s) and B16 or B16/HY tumour tissues (q, t) with anti-Vβ6PE, anti-CD4PerCP, and anti-Thy-1.2APC. Donor Treg cells were identified by co-expression of Thy-1.2 and Vβ6 (R2). Fluorescence-activated cell sorter dot plots of one representative mouse of each group are shown. An equal number of events in the live lymphocyte gate were acquired for the paired samples (2 × 10⁴ for dLN, 5 × 10⁴ for spleen and 5 × 10³ for B16 and B16/HY). One representative experiment of two is shown. (u–w) Quantitative comparison of donor Treg frequency in dLN (u), spleen (v) and tumour mass (w) between two groups.
Figure 5
Figure 5
Expansion of Marilyn natural regulatory T (nTreg) cells by MB49 is dependent on transforming growth factor-β (TGF-β). (a) MB49 cells were cultured with 10% fetal calf serum RPMI-1640 in the presence of 1 μg/ml brefeldin A for 4 hr. After fixing and permeabilizing, the cells were stained for anti-TGF-βPE (filled) or isotype control (open). (b–e) Two groups of Thy-1.1 B6 females (three mice/group) were transferred with 105 Thy-1.2 Marilyn nTreg cells co-expressing dnTGFβRII (Mar-nTregdn), of which one group of mice received MB49 cells next day (c–e). Eleven days after tumour inoculation, analysis was conducted by staining the cells with anti-Vβ6PE, anti-CD4PerCP and anti-Thy-1.2APC, before intracellular staining with anti-Foxp3FITC. The donor cells were identified by co-expression of Thy-1.2 and Vβ6 (R3). A total of 2 million events was acquired for each sample.
Figure 6
Figure 6
Comparison of Marilyn regulatory T (Treg) cells with or without dnTGFβRII in vivo and in vitro. Five groups of Rag2−/− B6 females (four mice/group) were transferred with 2 × 10⁴ Thy-1.1 Marilyn CD4 T cells alone (a–c), 2 × 10⁴ Thy-1.2 Marilyn Treg cells alone (m), 2 × 10⁴ Thy-1.2 Marilyn Treg cells co-expressing dnTGFbRII alone (n), or Thy-1.1 Marilyn CD4 mixed with either Thy-1.2 Marilyn nTreg cells (d to f) or Thy-1.2 Marilyn Treg cells co-expressing dnTGFbRII (g–i). The mice in all groups were also inoculated subcutaneously with 1 × 105 MB49 cells on the same day. Twelve days later, analysis was performed by staining dLN, spleen and MB49 tissues with anti-Vβ6FITC, anti-CD4PE, anti-Thy-1.1PerCP and anti-Thy-1.2APC. The donor responder and donor Treg cells were identified by co-expression of Thy-1.1 and Vβ6 (R4, a–i) and Thy-1.2 and CD4 (R6, m–n), respectively. The representation of donor responder cells in dLN of three groups [responders alone (R alone), responders plus Marilyn Treg cells (R+Treg), and responders plus dnTGFbRII-expressing Marilyn Treg cells (R+Tregdn)] was displayed as frequency (j) or absolute cell numbers (k). (l) Frequency of donor Treg cells in draining lymph nodes (dLN) of two co-transfer groups [responders plus Marilyn Treg cells (Treg), and responders plus dnTGFbRII-expressing Marilyn Treg cells (Tregdn)]. The representation of donor Treg cells in dLN of two groups [Marilyn Treg cells alone (Treg), and dnTGFbRII-expressing Marilyn Treg cells alone (Tregdn)] is shown in (m, n), (o) shows the comparison of the frequency of donor Treg cells in dLN of these two groups. One representative experiment of two is shown. A total of 0.5 million events was acquired for each sample. (p) In vitro suppression assay. Marilyn CD4+ CD25 T cells alone (1 × 10⁴/well), Marilyn CD4+ CD25+ dnTGFbRII+ cells alone (1 × 10⁵/well), or both populations were incubated with 50 nm HY/Dby peptide in the presence of antigen-presenting cells (5 × 10⁴/well, T-cell-depleted B6 female spleen cells) in round-bottomed 96-well plates for 3 days. Thymidine was added to each well for the last 12 hr. One representative experiment of two is shown.
Figure 7
Figure 7
CD11c+ cells in draining lymph nodes (dLN) of MB49 tumour display HY antigens. Three groups of B6 females (two mice/group) were inoculated with MB49 cells at day – 21 (G1), day – 14 (G2) or day – 7 (G3) whereas mice in G4 were not. At day 0, pooled dLN cells in G1, G2 and G3 and pooled peripheral lymph node (pLN) cells in G4 were digested before magnetic antibody cell sorting positive section. Purified CD11c+, CD11b+ and B220+ cells were irradiated before culturing at 3 × 10⁴/well without (white bars) or with (black bars) purified Marilyn CD4 T cells (1.7 × 10⁵/well) in 96-well round-bottomed plates for 3 days.

Similar articles

Cited by

References

    1. Sakaguchi S, Sakaguchi N, Asano M, Itoh M, Toda M. Immunologic self-tolerance maintained by activated T cells expressing IL-2 receptor alpha-chains (CD25). Breakdown of a single mechanism of self-tolerance causes various autoimmune diseases. J Immunol. 1995;155:1151–64. - PubMed
    1. Kohm AP, McMahon JS, Podojil JR, Begolka WS, DeGutes M, Kasprowicz DJ, Ziegler SF, Miller SD. Cutting edge: anti-CD25 monoclonal antibody injection results in the functional inactivation, not depletion, of CD4+ CD25+ T regulatory cells. J Immunol. 2006;176:3301–5. - PubMed
    1. Kim JM, Rasmussen JP, Rudensky AY. Regulatory T cells prevent catastrophic autoimmunity throughout the lifespan of mice. Nat Immunol. 2007;8:191–7. - PubMed
    1. Houghton AN, Guevara-Patiño JA. Immune recognition of self in immunity against cancer. J Clin Invest. 2004;114:468–71. - PMC - PubMed
    1. Shimizu J, Yamazaki S, Sakaguchi S. Induction of tumor immunity by removing CD25+ CD4+ T cells: a common basis between tumor immunity and autoimmunity. J Immunol. 1999;163:5211–8. - PubMed

Publication types

MeSH terms