. 2010 Aug 20;142(4):590-600.
doi: 10.1016/j.cell.2010.07.018.

ATG12 conjugation to ATG3 regulates mitochondrial homeostasis and cell death

Affiliations

ATG12 conjugation to ATG3 regulates mitochondrial homeostasis and cell death

Lilliana Radoshevich et al. Cell. .

Abstract

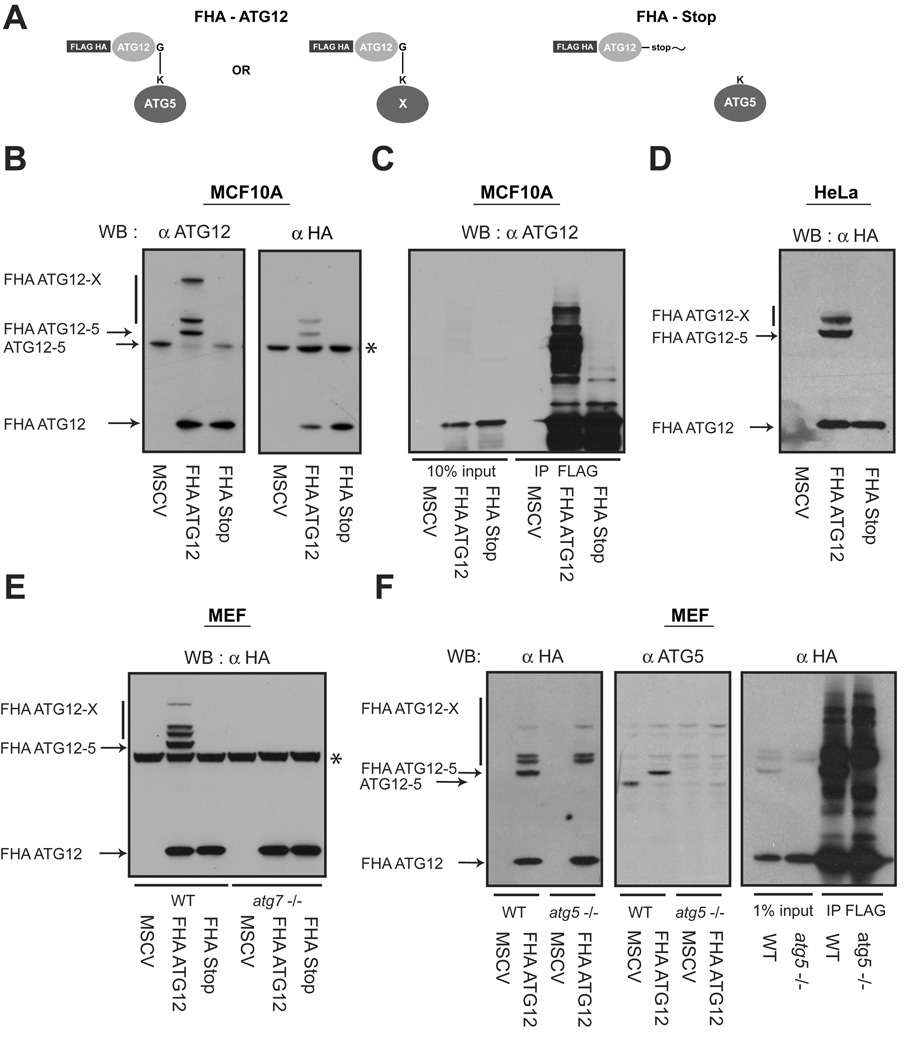
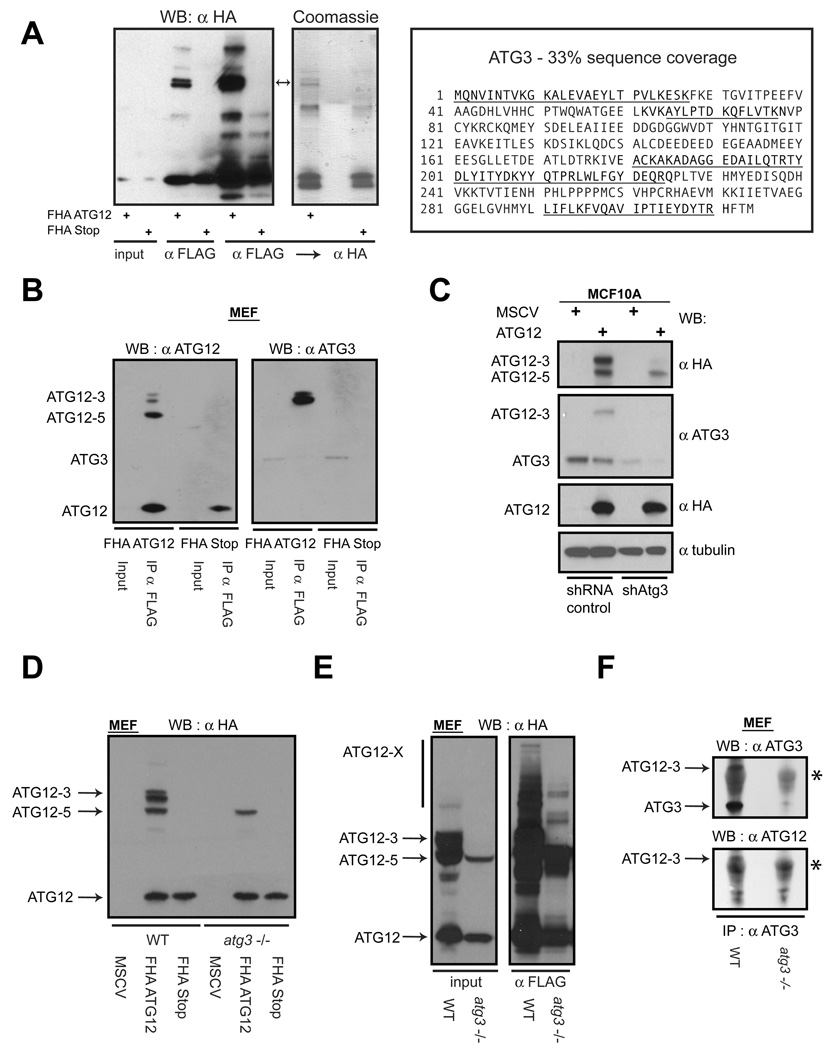
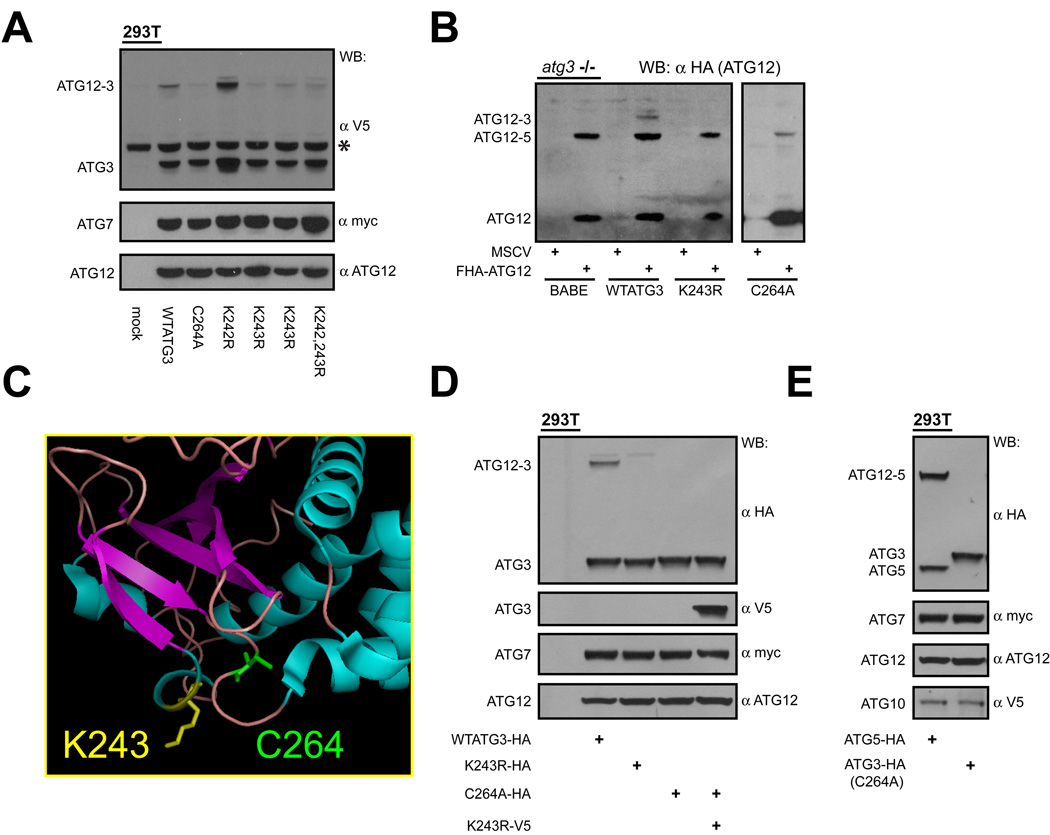
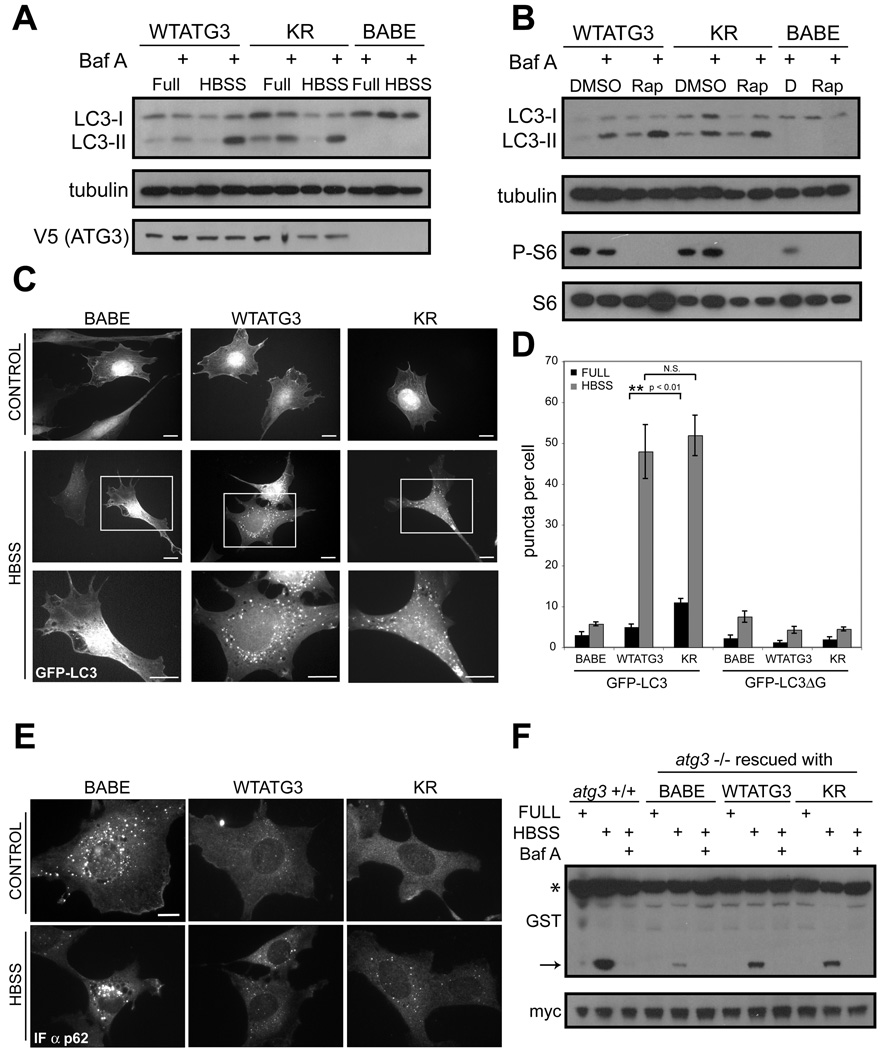
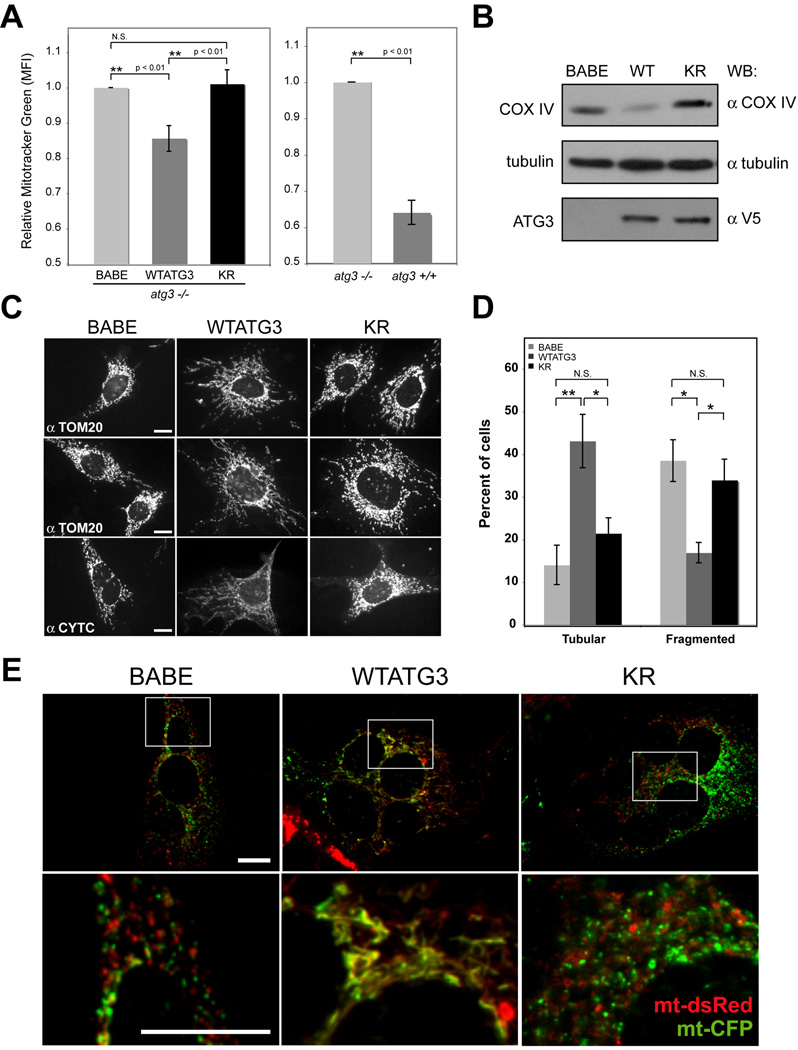
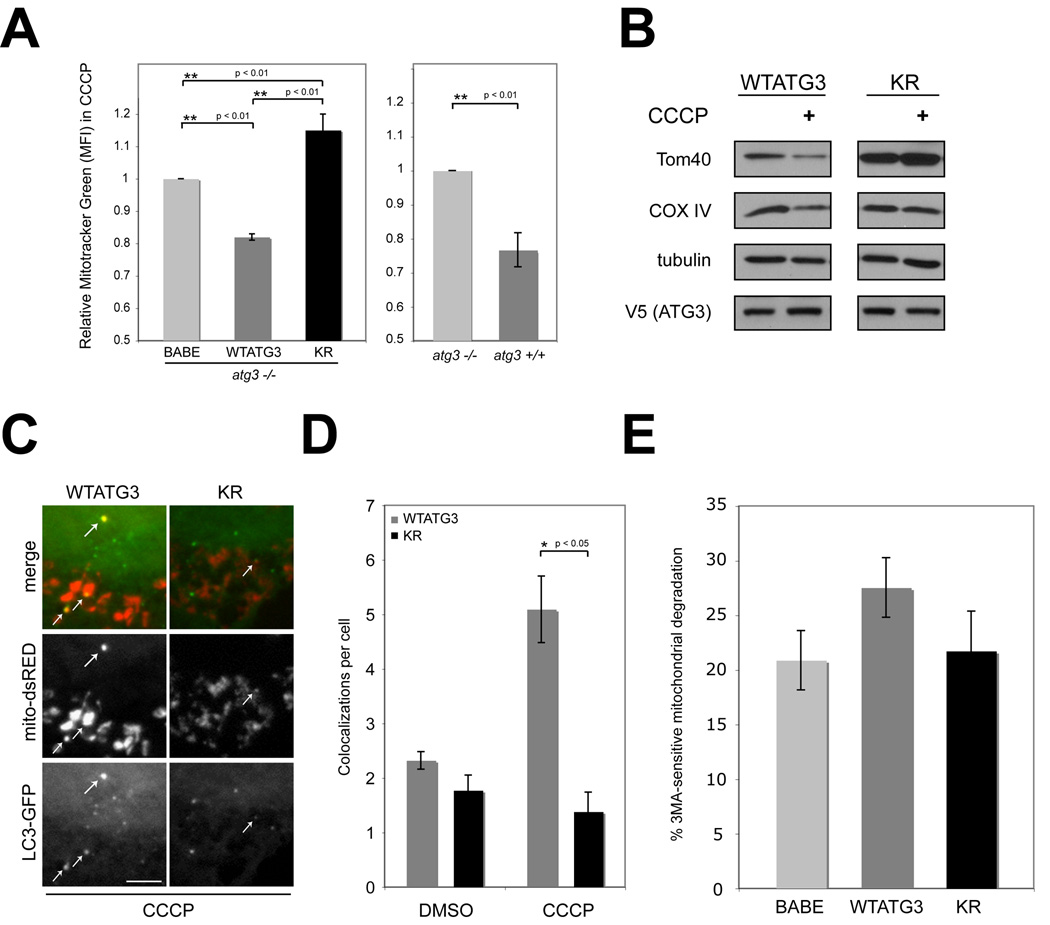
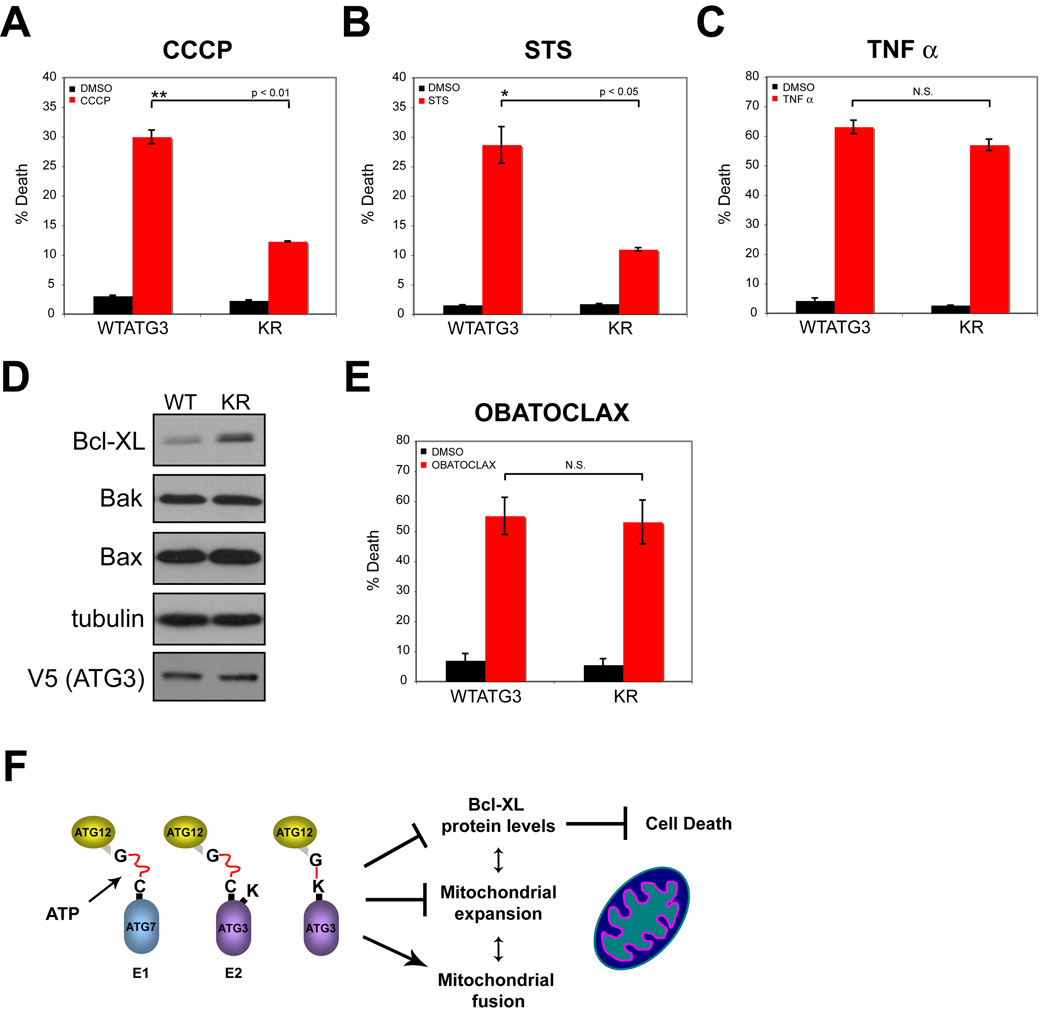
ATG12, an ubiquitin-like modifier required for macroautophagy, has a single known conjugation target, another autophagy regulator called ATG5. Here, we identify ATG3 as a substrate for ATG12 conjugation. ATG3 is the E2-like enzyme necessary for ATG8/LC3 lipidation during autophagy. ATG12-ATG3 complex formation requires ATG7 as the E1 enzyme and ATG3 autocatalytic activity as the E2, resulting in the covalent linkage of ATG12 onto a single lysine on ATG3. Surprisingly, disrupting ATG12 conjugation to ATG3 does not affect starvation-induced autophagy. Rather, the lack of ATG12-ATG3 complex formation produces an expansion in mitochondrial mass and inhibits cell death mediated by mitochondrial pathways. Overall, these results unveil a role for ATG12-ATG3 in mitochondrial homeostasis and implicate the ATG12 conjugation system in cellular functions distinct from the early steps of autophagosome formation.


Figures

Figure 1
Figure 1. ATG12 covalently modifies multiple protein targets in mammalian cells
(A) Schematic of ATG12 constructs: FHA-ATG12 is mouse ATG12 tandem tagged at the N-terminus with FLAG and HA epitopes. In FHA-Stop, the C-terminal glycine in ATG12 required for conjugation is replaced with a Stop codon. (B) MCF10A cells stably expressing empty vector (MSCV), FHA-ATG12 and FHA-Stop were lysed and immunoblotted with α-ATG12 and α-HA antibodies. Asterisk (*) indicates non-specific band during α-HA immunoblotting. (C) MCF10A cells stably expressing the indicated constructs were lysed and immunoprecipitated with α-FLAG; immune complexes were resolved using SDS-PAGE and immunoblotted with α-ATG12. (D) HeLa cells stably expressing the indicated constructs were lysed and immunoblotted with α-HA. (E) atg7+/+ (WT) and atg7−/− mouse embryonic fibroblasts (MEFs) stably expressing the indicated constructs were lysed and immunoblotted with α-HA. Asterisk (*) indicates nonspecific band. (F) Left: atg5+/+ (WT) and atg5−/− stably expressing the indicated constructs were lysed and immunoblotted with α-HA or α-ATG5. Right: WT and atg5−/− MEFs expressing FHA-ATG12 were lysed and immunoprecipitated with α-FLAG; immune complexes were resolved and immunoblotted with α-HA.
Figure 2
Figure 2. ATG12 and ATG3 form a covalent complex
(A) Lysates from atg5−/− MEFs stably expressing FHA-ATG12 or FHA-Stop were subject to affinity purification with α-FLAG followed by α-HA antibodies. Eluted proteins were resolved using SDS-PAGE and immunoblotted with α-HA (left) or stained with Coomassie (middle). Each protein in the indicated doublet (arrows) was individually subject to MS/MS analysis and both were identified as ATG3. Right: Amino acid sequence of mouse ATG3; underlined sequences correspond to independent peptides identified by mass spectrometry. (B) Lysates from MEFs expressing the indicated constructs were immunoprecipitated with α-FLAG; immune complexes (FLAG IP) were resolved using SDS-PAGE and immunoblotted with α-ATG12 or α-ATG3. (C) MCF10A cells stably expressing FHA-ATG12 were infected with lentiviruses encoding non-targeting control shRNA or shRNA targeted to ATG3 (shATG3). Lysates were immunoblotted as indicated. (D) Wild type and atg3−/− MEFs stably expressing the indicated constructs were lysed and subject to α-HA immunoblotting. (E) Wild type and atg3−/− MEFs stably expressing FHA-ATG12 were lysed and subject to α-FLAG immunoprecipitation; immune complexes were resolved and immunoblotted with α-HA. (F) Lysates from wild type and atg3−/− MEFs were immunoprecipated with α-ATG3; immune complexes were resolved using SDS-PAGE and subject to α-ATG3 or α-ATG12 immunoblotting. Asterisk (*) indicates immunoglobulin heavy chain. See also Figure S1.
Figure 3
Figure 3. Auto-conjugation of ATG12 onto a single lysine of ATG3
(A) HEK293T cells expressing YFP-ATG12, Myc-tagged ATG7, and V5-tagged WTATG3 or the indicated ATG3 mutants. (B) atg3−/− MEFs stably reconstituted with empty vector (BABE), wild type ATG3, or the indicated ATG3 mutants, were then transduced with empty vector (MSCV) or FHA-ATG12. Lysates were α-HA immunoblotted to detect ATG12-conjugated proteins. (C) Crystal structure of yeast ATG3 with labeled α-helices (blue) and β-sheets (purple). Positions of the conserved catalytic cysteine (C264 in mouse ATG3, green) and the principal lysine conjugated with ATG12 (K243, yellow) are shown. Diagram prepared using PyMOL. (D) 293T cells transfected with YFP-ATG12, myc-tagged ATG7 and mutants of either HA or V5-tagged ATG3, as indicated. (E) HEK293T cells transfected with Myc-tagged ATG7, V5-tagged ATG10, YFP-ATG12 and either HA-tagged ATG5 or ATG3 C264A; catalytically inactive ATG3 (C264A) was used to distinguish the E2 activity of ATG10 from ATG3 during ATG12-ATG3 formation. See also Figure S2.
Figure 4
Figure 4. Starvation-induced autophagy remains intact upon disrupting ATG12 conjugation to ATG3
Stable pools of atg3−/− fibroblasts expressing an empty vector (BABE), wild type mouse ATG3 (WTATG3) or mutant ATG3 unable to be conjugated by ATG12 (KR) were used for experiments as indicated. (A and B) Cells were grown in complete media, starved in Hank’s buffered salt solution (HBSS) for 4h, or treated with 10nM rapamycin (B) for 6h. Cells were lysed and immunoblotted with indicated antibodies. Phosphorylated ribosomal S6 (P-S6) was used to verify rapamycin-mediated mTORC1 inhibition. When indicated, bafilomycin A (BafA, 10nM) was added to cells 1h prior to lysis. (C) Indicated cells types expressing GFP-LC3 were grown in complete media (control) or HBSS-starved for 4h; boxed areas from center panels are enlarged below. Bars, 25µm. (D) Quantification of punctate GFP-LC3 or GFP-LC3ΔG (mean +/−SEM puncta per cell). (E) Indicated cell types grown in complete media (control) or HBSS-starved for 4h, and then fixed and immunostained with α-p62 antibody. Bar, 25µm. (F) Indicated cell types were transfected with a GST-BHMT fusion construct, HBSS-starved for 6h, lysed and immunoblotted with α-GST. Asterisk (*) indicates full-length GST-BHMT and arrow indicates cleaved BHMT produced in autolysosomes. When indicated, bafilomycin A (BafA, 10nM) was used to inhibit lysosomal function. α-Myc was used to detect GFP-myc (expressed from an IRES sequence) to control for transfection efficiency (Dennis and Mercer, 2009). See also Figure S3.
Figure 5
Figure 5. Effects of disrupting ATG12 conjugation to ATG3 on mitochondrial mass and morphology
(A) Left: Mitotracker Green (MTG) fluorescence intensity (mean+/−SEM from 5 experiments) for the indicated cell types relative to atg3−/− cells expressing empty vector (BABE). Statistical significance calculated using ANOVA, followed by Tukey's HSD test. Right: MTG fluorescence intensity (mean+/−SEM from 3 experiments) for atg3+/+ cells relative to atg3−/− cells. (B) Lysates from indicated cell types were immunoblotted with α-COX IV, α-tubulin and α-V5. (C) Indicated cell types were immunostained with TOM20 (top and middle) or cytochrome c (bottom) antibodies. (D) Percent of cells with purely fragmented/round morphology or purely tubular morphology was quantified from TOM20-immunostained images. Results are the mean+/−SEM from 5 experiments, where at least 250 cells were scored per condition for each individual experiment. Statistical significance calculated using ANOVA, followed by Tukey's HSD test. (E) Cells expressing either mitochondria-targeted dsRed (mt-dsRed, red) or CFP (mt-CFP, green) were hybridized using PEG to assess mitochondrial fusion activity. Representative merged images of cell hybrids from each cell type are shown; the colocalization of these signals (yellow) within cell hybrids indicates mitochondrial fusion (Chen et al., 2003). Each bottom panel is an enlargement of the boxed inset in the corresponding panel above. Bar, 25µm. See also Figures S4 and S5.
Figure 6
Figure 6. Effects of CCCP treatment on mitochondria in cells expressing a non-conjugatable ATG3 mutant (KR)
(A) Left: Cells treated with 10 µM CCCP for 24h and stained with MTG. MTG fluorescence intensity (mean+/−SEM from 8 experiments) relative to atg3−/− cells expressing empty vector (BABE) is shown. Statistical significance calculated using ANOVA, followed by Tukey's HSD test. Right: MTG fluorescence intensity (mean+/−SEM from 3 experiments) for CCCP-treated atg3+/+ cells relative to atg3−/− cells. (B) Cells were CCCP-treated as indicated, lysed and immunoblotted with antibodies against the resident mitochondrial proteins, TOM40 and COX IV, V5 and tubulin (loading control). (C) Indicated cell types expressing GFP-LC3 were transfected with mito-dsRed and treated with 10µM CCCP for 24h. White arrows indicate colocalization of GFP-LC3 and mito-dsRed. Bar, 5µm (D) Quantification of mito-dsRed and GFP-LC3 colocalizations per cell (mean+/−SEM). (E) 3MA-sensitive mitochondrial degradation (mean+/−SEM from 5 experiments) during CCCP treatment. See also Figure S6.
Figure 7
Figure 7. Cells lacking ATG12-ATG3 exhibit decreased cell death mediated by mitochondrial pathways
Cells were treated for 24h with the following agents: (A) 100 µM CCCP; (B) 100nM staurosporine; and (C) 20ng/mL TNF-α + 2.5µg/mL cycloheximide. Percent cell death (mean+/−SEM) was assayed by propidium iodide uptake using flow cytometry. (D) Lysates prepared from WTATG3 and KR cells were immunoblotted for the indicated markers. (E) Cells were treated for 24h with 500 nM obatoclax. Cell death (mean +/−SEM) was quantified using trypan blue exclusion. Statistical significance calculated using t test. (F) Summary model of results.

References

    1. Berman SB, Chen YB, Qi B, McCaffery JM, Rucker EB, 3rd, Goebbels S, Nave KA, Arnold BA, Jonas EA, Pineda FJ, Hardwick JM. Bcl-x L increases mitochondrial fission, fusion, and biomass in neurons. J Cell Biol. 2009;184:707–719. - PMC - PubMed
    1. Bjorkoy G, Lamark T, Brech A, Outzen H, Perander M, Overvatn A, Stenmark H, Johansen T. p62/SQSTM1 forms protein aggregates degraded by autophagy and has a protective effect on huntingtin-induced cell death. J Cell Biol. 2005;171:603–614. - PMC - PubMed
    1. Brenner D, Mak TW. Mitochondrial cell death effectors. Curr Opin Cell Biol. 2009 - PubMed
    1. Chen H, Chan DC. Mitochondrial dynamics--fusion, fission, movement, and mitophagy--in neurodegenerative diseases. Hum Mol Genet. 2009;18:R169–R176. - PMC - PubMed
    1. Chen H, Detmer SA, Ewald AJ, Griffin EE, Fraser SE, Chan DC. Mitofusins Mfn1 and Mfn2 coordinately regulate mitochondrial fusion and are essential for embryonic development. J Cell Biol. 2003;160:189–200. - PMC - PubMed

Publication types

MeSH terms