

A practical guide to understanding Kaplan-Meier curves
- PMID: 20723767
- PMCID: PMC3932959
- DOI: 10.1016/j.otohns.2010.05.007
A practical guide to understanding Kaplan-Meier curves
Abstract
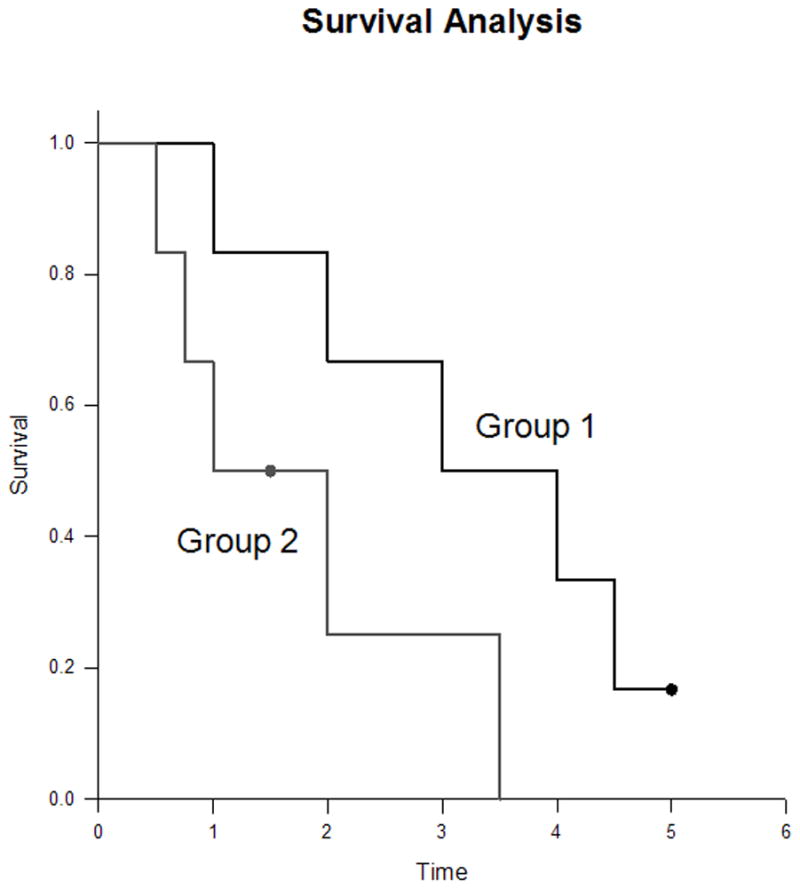
In 1958, Edward L. Kaplan and Paul Meier collaborated to publish a seminal paper on how to deal with incomplete observations. Subsequently, the Kaplan-Meier curves and estimates of survival data have become a familiar way of dealing with differing survival times (times-to-event), especially when not all the subjects continue in the study. "Survival" times need not relate to actual survival with death being the event; the "event" may be any event of interest. Kaplan-Meier analyses are also used in nonmedical disciplines. The purpose of this article is to explain how Kaplan-Meier curves are generated and analyzed. Throughout this article, we will discuss Kaplan-Meier estimates in the context of "survival" before the event of interest. Two small groups of hypothetical data are used as examples in order for the reader to clearly see how the process works. These examples also illustrate the crucially important point that comparative analysis depends upon the whole curve and not upon isolated points.
Copyright 2010 American Academy of Otolaryngology-Head and Neck Surgery Foundation. Published by Mosby, Inc. All rights reserved.
Figures
References
-
- Kaplan EL, Meier P. Nonparametric estimation from incomplete observations. Journal of the American Statistical Association. 1958;53:457–81.
-
- Altman DG. Practical statistics for medical research. New York: Chapman & Hall/CRC; 1991. pp. 365–396.
-
- Feinstein AR. The architecture of clinical research. Philadelphia: W. B. Saunders Co; 1985. Clinical Epidemilogy; pp. 226–227.pp. 335pp. 343–346.
-
- Henschke CI, Yankelevitz DF, Libby DM, et al. Survival of patients with stage I lung cancer detected on CT screening. NEJM. 2006;355:1763–71. - PubMed
-
- Carter RE, Huang P. Cautionary note regarding the use of CIs obtained from Kaplan-Meier survival curves. J Clin Oncol. 2009;27:174–75. - PubMed
Publication types
MeSH terms
Grants and funding
LinkOut - more resources
Full Text Sources
Other Literature Sources
