

Visual enhancement of laparoscopic partial nephrectomy with 3-charge coupled device camera: assessing intraoperative tissue perfusion and vascular anatomy by visible hemoglobin spectral response
- PMID: 20723937
- PMCID: PMC7371002
- DOI: 10.1016/j.juro.2010.06.010
Visual enhancement of laparoscopic partial nephrectomy with 3-charge coupled device camera: assessing intraoperative tissue perfusion and vascular anatomy by visible hemoglobin spectral response
Abstract
Purpose: We report the novel use of 3-charge coupled device camera technology to infer tissue oxygenation. The technique can aid surgeons to reliably differentiate vascular structures and noninvasively assess laparoscopic intraoperative changes in renal tissue perfusion during and after warm ischemia.
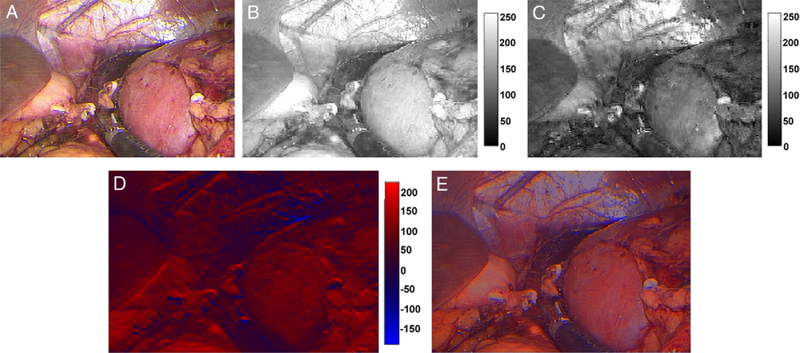
Materials and methods: We analyzed select digital video images from 10 laparoscopic partial nephrectomies for their individual 3-charge coupled device response. We enhanced surgical images by subtracting the red charge coupled device response from the blue response and overlaying the calculated image on the original image. Mean intensity values for regions of interest were compared and used to differentiate arterial and venous vasculature, and ischemic and nonischemic renal parenchyma.
Results: The 3-charge coupled device enhanced images clearly delineated the vessels in all cases. Arteries were indicated by an intense red color while veins were shown in blue. Differences in mean region of interest intensity values for arteries and veins were statistically significant (p >0.0001). Three-charge coupled device analysis of pre-clamp and post-clamp renal images revealed visible, dramatic color enhancement for ischemic vs nonischemic kidneys. Differences in the mean region of interest intensity values were also significant (p <0.05).
Conclusions: We present a simple use of conventional 3-charge coupled device camera technology in a way that may provide urological surgeons with the ability to reliably distinguish vascular structures during hilar dissection, and detect and monitor changes in renal tissue perfusion during and after warm ischemia.
Copyright © 2010 American Urological Association Education and Research, Inc. Published by Elsevier Inc. All rights reserved.
Figures


References
-
- Link RE, Bhayani SB, Allaf ME et al. : Exploring the learning curve, pathological outcomes and perioperative morbidity of laparoscopic partial nephrectomy performed for renal mass. J Urol 2005; 173: 1690. - PubMed
-
- Lane BR and Gill IS: 5-Year outcomes of laparoscopic partial nephrectomy. J Urol 2007; 177: 70. - PubMed
-
- Allaf ME, Bhayani SB, Rogers C et al. : Laparoscopic partial nephrectomy: evaluation of long-term oncological outcome. J Urol 2004; 172: 871. - PubMed
-
- Permpongkosol S, Bagga HS, Romero FR et al. : Laparoscopic versus open partial nephrectomy for the treatment of pathological T1N0M0 renal cell carcinoma: a 5-year survival rate. J Urol 2006; 176: 1984. - PubMed
-
- Kennedy TJ: Impact of video on endourology. J Endourol 1987; 1: 75.
