. 2010 Oct 22;285(43):32860-32868.
doi: 10.1074/jbc.M110.111591. Epub 2010 Aug 19.

2E8 binds to the high affinity I-domain in a metal ion-dependent manner: a second generation monoclonal antibody selectively targeting activated LFA-1

Affiliations

2E8 binds to the high affinity I-domain in a metal ion-dependent manner: a second generation monoclonal antibody selectively targeting activated LFA-1

Roberto Carreño et al. J Biol Chem. .

Abstract

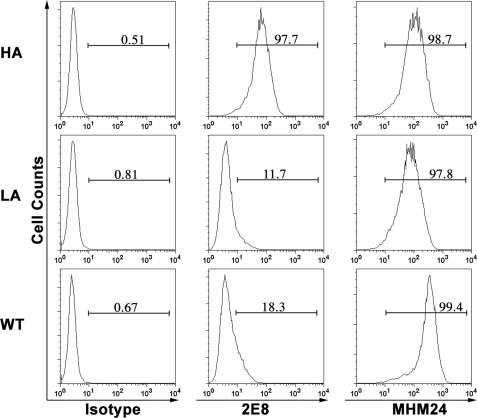
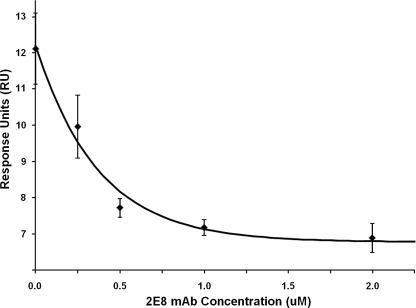
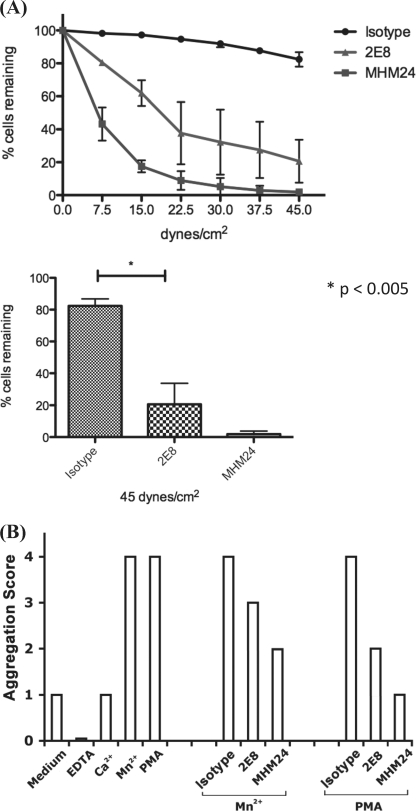
The activation of leukocyte function-associated antigen-1 (LFA-1) plays a critical role in regulating immune responses. The metal ion-dependent adhesion site on the I-domain of LFA-1 α(L) subunit is the key recognition site for ligand binding. Upon activation, conformation changes in the I-domain can lead LFA-1 from the low affinity state to the high affinity (HA) state. Using the purified HA I-domain locked by disulfide bonds for immunization, we developed an mAb, 2E8, that specifically binds to cells expressing the HA LFA-1. The surface plasmon resonance analysis has shown that 2E8 only binds to the HA I-domain and that the dissociation constant (K(D)) for HA I-domain is 197 nm. The binding of 2E8 to the HA I-domain is metal ion-dependent, and the affinity decreased as Mn(2+) was replaced sequentially by Mg(2+) and Ca(2+). Surface plasmon resonance analysis demonstrates that 2E8 inhibits the interaction of HA I-domain and ICAM-1. Furthermore, we found that 2E8 can detect activated LFA-1 on both JY and Jurkat cells using flow cytometry and parallel plate adhesion assay. In addition, 2E8 inhibits JY cell adhesion to human umbilical vein endothelial cells and homotypic aggregation. 2E8 treatment reduces the proliferation of both human CD4(+) and CD8(+) T cells upon OKT3 stimulation without the impairment of their cytolytic function. Taken together, these data demonstrate that 2E8 is specific for the high affinity form of LFA-1 and that 2E8 inhibits LFA-1/ICAM-1 interactions. As a novel activation-specific monoclonal antibody, 2E8 is a potentially useful reagent for blocking high affinity LFA-1 and modulating T cell activation in research and therapeutics.


Figures

FIGURE 1.
FIGURE 1.
Binding of 2E8 to K562 cells expressing HA LFA-1. The binding of isotype control, 2E8, or MHM24 mAb to K562 cells expressing locked HA (K287C/K297C), LA (K287C/K294C), or WT LFA-1 was determined by flow cytometric analysis. The x axis depicts the relative fluorescence intensity of individual cells, and the y axis represents the cell count. The percentage of gated cells positive for each mAb was displayed in each histogram.
FIGURE 2.
FIGURE 2.
Biacore SPA analysis of 2E8 binding to HA I-domain. A, real time SPR of 2E8 specificity to the HA (red), IA (magenta), or WT (blue) I-domain. 2E8 was coupled to a CM5 sensor chip by amine coupling. LFA-1 I-domains (WT, IA, and HA) at concentrations of 400 nm were subsequently injected over the CM5 chip at 10 μl/min with Running Buffer A. B, real time SPR of divalent metal ion dependence of HA I-domain binding to 2E8. HA I-domain at concentrations of 400 nm was injected over the CM5 chip coupled with 2E8 with Running Buffer A. The samples were run under different metal ions, replacing the MgSO4 in Running Buffer A with CaSO4 or MnSO4. Black, Mn2+; blue, Mg2+; green, Ca2+; red, EDTA.
FIGURE 3.
FIGURE 3.
The exponential decay of HA I-domain binding to ICAM-1-Fc in the presence of 2E8. ICAM-1-Fc was immobilized on the SPR chip, and 2 μm HA I-domain was run across the chip. Then 2 μm HA I-domain was titrated simultaneously with 0.25, 0.50, 1.0, and 2.0 μm 2E8, and the binding of HA I-domain binding to ICAM-1-Fc was measured. Data points were averages of three experiments with error bars denoting S.D. The exponential decay fit was computed by a first-order exponential decay fit using MicroCal Origin v6.0.
FIGURE 4.
FIGURE 4.
Binding of 2E8 to activated LFA-1 on cell lines. Jurkat or JY cells were left untreated (NT) or stimulated with Mn2+ (5 mm) in the presence of 2E8, MHM24, or isotype control mAb at the concentration of 1 μg/ml and then incubated at 4 °C for 30 min. Cells were stained with secondary Alexa Fluor488-conjugated goat anti-mouse IgG (Invitrogen) and then washed and resuspended in PBS with 2% paraformaldehyde for 20 min at 4 °C. All experimental conditions were performed in triplicate and analyzed by flow cytometry using a FACSCalibur (BD Biosciences). A, binding of 2E8 and MEM24 to Jurkat cells. Staining of 2E8 and MHM24 is shown in solid lines, and isotype control is shown in dashed lines. The mean fluorescence intensity (MFI) and the percentage of gated cells positive for mAbs are representative of three independent experiments. B, the mean fluorescence intensity of 2E8 binding to Jurkat and JY cells. Results were mean and S.D. of three independent experiments. The asterisk represents data with p value less than 0.05 in the Student's t test.
FIGURE 5.
FIGURE 5.
Adhesion of activated LFA-1 to 2E8 under shear force in parallel plate flow assay. JY (A) or Jurkat (B) cells were either untreated (NT) or stimulated with Mn2+ (5 mm) before being injected into the flow chamber and allowed to adhere to slides coated with mAbs or BSA. Top, a linear gradient of shear flow increasing from 0–51 dynes/cm2 was perfused over the adhered cells, and the extent of adhesion was determined by the percentage of cells remaining at particular shear forces. The baseline of cell adhesion for each mAb was established with the untreated sample (NT), which showed a linear steady rate of detachment as the shear forces increase over time. A linear gradient of shear flow was applied to the adhered cells, and the percentages of cells remaining were enumerated every 50 s. The data represent the average of three independent experiments with error bars. Bottom, the percentage of cells remaining adhered to the coated slides at 45 dynes/cm2. The error bars indicate the S.E., and the p value (**) was generated using the Student's t test.
FIGURE 6.
FIGURE 6.
Inhibition of JY cell adhesion and homotypic aggregation by 2E8. A, JY cell adhesion to TNF-α stimulated HUVECs. HUVECs were cultured on the slides and stimulated with TNF-α (10 units/ml) for 24 h. JY cells were pretreated with isotype control, 2E8, or MHM24 mAb (1 μg/ml) upon the addition of Mn2+ (5 mm). Activated JY cells were injected into the flow chamber and allowed to adhere to slides coated with HUVECs. Top, a linear gradient of shear flow increasing from 0 to 51 dynes/cm3 was perfused over the adhered cells, and the extent of adhesion was determined by enumerating the percentage of cells remaining at 50-s intervals. The data represent the average of three independent experiments with error bars. Bottom, the percentage of cells remaining adhered to HUVECs at 45 dynes/cm2. The error bars indicate the S.E., and the p value was generated using the Student's t test. B, homotypic aggregation. JY cells were treated with Mn2+ (1 mm) or phorbol 12-myristate 13-acetate (PMA) (10 ng/ml) in the presence of 50 nm of isotype control, 2E8, or MHM24 mAb. Cells treated with 1 mm Mn2+, 10 ng/ml phorbol 12-myristate 13-acetate, 1 mm Ca2+, or 1 mm EDTA, or cells without any treatment were used as controls. Aggregation was scored as described under “Experimental Procedures.” Three independent experiments showed identical results.
FIGURE 7.
FIGURE 7.
Effect of 2E8 and MHM24 on human T cell proliferation. PBMCs labeled with CFSE were stimulated by OKT3 (300 ng/ml) for 5 days in the presence of various concentrations of 2E8 (solid line: 0.5, 5, or 50 μg/ml) or MHM24 (shadow: 5 μg/ml). A, T cell proliferation was assessed by CFSE dye dilution following sequential gating on lymphocytes (by scatter) and CD4+ or CD8+ T cells. Each histogram plot represents the cell division overlay in the presence of different concentrations of 2E8 (solid line) and 5 μg/ml MHM24 (shadow). The percentage of dividing cells in the presence of various concentration of 2E8 was shown on the histogram. Representative sample data of three independent experiments were presented. B, the relative division index of CD4+ and CD8+ T cells in the presence of 2E8 and MHM24. The proliferation kinetics were analyzed by FlowJo, and cell proliferation models were generated based on the CFSE histogram data. The cell division index was calculated by FlowJo based on the proliferation kinetics. Data shown here are representative of three independent experiments from three different samples. Results were mean and S.D. of three independent samples. The asterisk represents data with p value less than 0.05 in the Student's t test.
FIGURE 8.
FIGURE 8.
Effect 2E8 and MHM24 on the cytolytic function of human T cells. The effector cells were generated from PBMCs primed with OKT3 stimulation for 5 days. Target cells were P815 cells labeled with DDAO-SE and incubated for 4 h with effector cells at the E:T ratios indicated, in the presence of 20 μg/ml isotype control, 2E8, or MHM24 mAb. Lysis of P815 was measured by the percentage of caspase-3-positive cells. A, representative data of specific lysis of P815 by human CTLs, with mean and S.D. of three independent experiments from one CTL sample. B, the reduction of specific cytotoxicity in the presence of 2E8 or MHM24 mAb at E:T ratio of 20:1. Results were mean and S.D. of three different samples from nine independent experiments. The asterisk represents data with p value less than 0.02 in the Student's t test.

References

    1. Springer T. A. (1994) Cell. 76, 301–314 - PubMed
    1. Dustin M. L. (2003) Ann. N.Y. Acad. Sci. 987, 51–59 - PubMed
    1. Carman C. V., Springer T. A. (2003) Curr. Opin. Cell Biol. 15, 547–556 - PubMed
    1. Hogg N., Smith A., McDowall A., Giles K., Stanley P., Laschinger M., Henderson R. (2004) Immunol. Lett. 92, 51–54 - PubMed
    1. Hynes R. O. (2003) Science. 300, 755–756 - PubMed

Publication types

MeSH terms