

Inhibition of nicotinamide phosphoribosyltransferase: cellular bioenergetics reveals a mitochondrial insensitive NAD pool
- PMID: 20724478
- PMCID: PMC2962509
- DOI: 10.1074/jbc.M110.136739
Inhibition of nicotinamide phosphoribosyltransferase: cellular bioenergetics reveals a mitochondrial insensitive NAD pool
Abstract
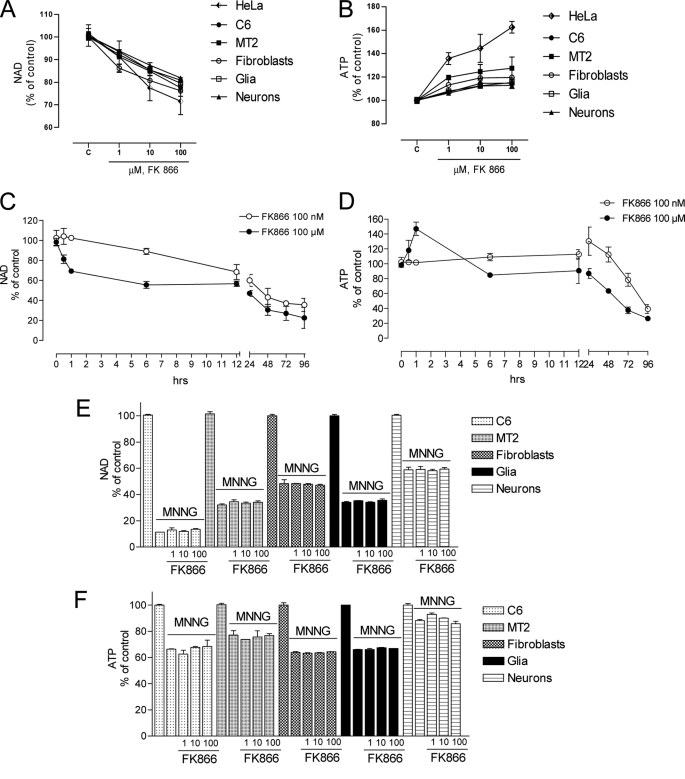
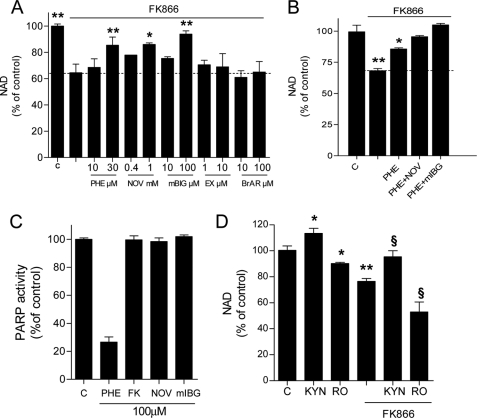
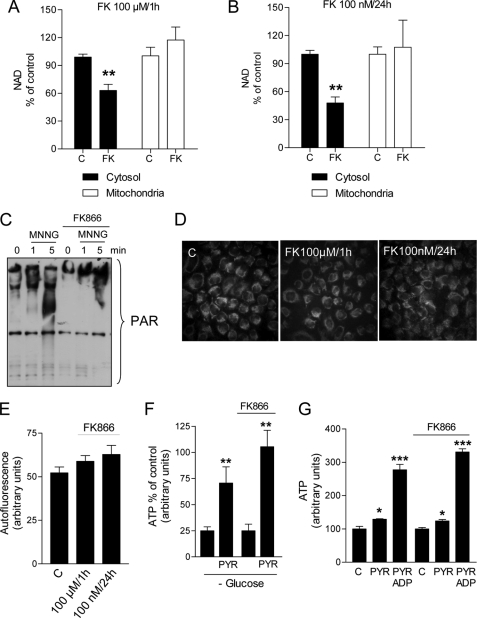
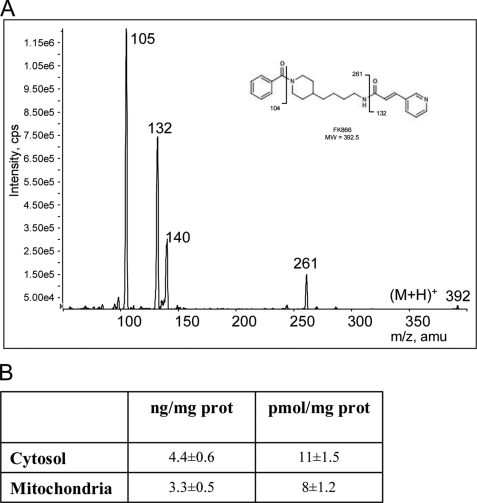
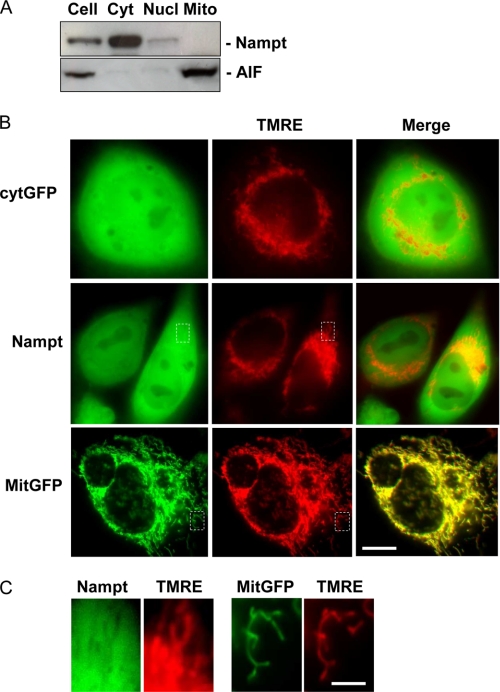
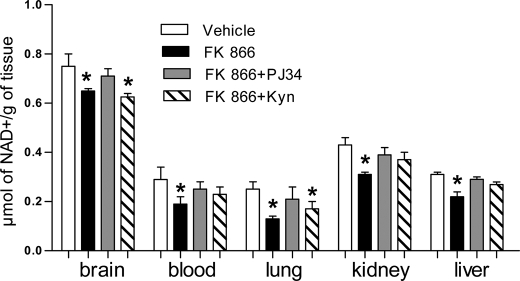
The NAD rescue pathway consists of two enzymatic steps operated by nicotinamide phosphoribosyltransferase (Nampt) and nicotinamide mononucleotide adenylyltransferases. Recently, the potent Nampt inhibitor FK866 has been identified and evaluated in clinical trials against cancer. Yet, how Nampt inhibition affects NAD contents and bioenergetics is in part obscure. It is also unknown whether NAD rescue takes place in mitochondria, and FK866 alters NAD homeostasis within the organelle. Here, we show that FK866-dependent reduction of the NAD contents is paralleled by a concomitant increase of ATP in various cell types, in keeping with ATP utilization for NAD resynthesis. We also show that poly- and mono(ADP-ribose) transferases rather than Sirt-1 are responsible for NAD depletion in HeLa cells exposed to FK866. Mass spectrometry reveals that the drug distributes in the cytosolic and mitochondrial compartment. However, the cytoplasmic but not the mitochondrial NAD pool is reduced upon acute or chronic exposure to the drug. Accordingly, Nampt does not localize within the organelles and their bioenergetics is not affected by the drug. In the mouse, FK866-dependent reduction of NAD contents in various organs is prevented by inhibitors of poly(ADP-ribose) polymerases or the NAD precursor kynurenine. For the first time, our data indicate that mitochondria lack the canonical NAD rescue pathway, broadening current understanding of cellular bioenergetics.
Figures
Similar articles
-
Nicotinamide phosphoribosyltransferase (NAMPT) activity is essential for survival of resting lymphocytes.Immunol Cell Biol. 2014 Feb;92(2):191-9. doi: 10.1038/icb.2013.85. Epub 2013 Nov 26. Immunol Cell Biol. 2014. PMID: 24275857
-
Catastrophic NAD+ depletion in activated T lymphocytes through Nampt inhibition reduces demyelination and disability in EAE.PLoS One. 2009 Nov 19;4(11):e7897. doi: 10.1371/journal.pone.0007897. PLoS One. 2009. PMID: 19936064 Free PMC article.
-
Detection and pharmacological modulation of nicotinamide mononucleotide (NMN) in vitro and in vivo.Biochem Pharmacol. 2009 May 15;77(10):1612-20. doi: 10.1016/j.bcp.2009.02.017. Epub 2009 Mar 5. Biochem Pharmacol. 2009. PMID: 19426698
-
Medicinal chemistry of nicotinamide phosphoribosyltransferase (NAMPT) inhibitors.J Med Chem. 2013 Aug 22;56(16):6279-96. doi: 10.1021/jm4001049. Epub 2013 May 31. J Med Chem. 2013. PMID: 23679915 Review.
-
Non-canonical roles of NAMPT and PARP in inflammation.Dev Comp Immunol. 2021 Feb;115:103881. doi: 10.1016/j.dci.2020.103881. Epub 2020 Oct 7. Dev Comp Immunol. 2021. PMID: 33038343 Review.
Cited by
-
Pharmacologic targeting of sirtuin and PPAR signaling improves longevity and mitochondrial physiology in respiratory chain complex I mutant Caenorhabditis elegans.Mitochondrion. 2015 May;22:45-59. doi: 10.1016/j.mito.2015.02.005. Epub 2015 Mar 3. Mitochondrion. 2015. PMID: 25744875 Free PMC article.
-
Crosstalk between poly(ADP-ribose) polymerase and sirtuin enzymes.Mol Aspects Med. 2013 Dec;34(6):1168-201. doi: 10.1016/j.mam.2013.01.004. Epub 2013 Jan 25. Mol Aspects Med. 2013. PMID: 23357756 Free PMC article. Review.
-
Location, Location, Location: Compartmentalization of NAD+ Synthesis and Functions in Mammalian Cells.Trends Biochem Sci. 2020 Oct;45(10):858-873. doi: 10.1016/j.tibs.2020.05.010. Epub 2020 Jun 25. Trends Biochem Sci. 2020. PMID: 32595066 Free PMC article. Review.
-
Switch of NAD Salvage to de novo Biosynthesis Sustains SIRT1-RelB-Dependent Inflammatory Tolerance.Front Immunol. 2019 Oct 11;10:2358. doi: 10.3389/fimmu.2019.02358. eCollection 2019. Front Immunol. 2019. PMID: 31681271 Free PMC article.
-
Nicotinamide adenine dinucleotide is transported into mammalian mitochondria.Elife. 2018 Jun 12;7:e33246. doi: 10.7554/eLife.33246. Elife. 2018. PMID: 29893687 Free PMC article.
References
Publication types
MeSH terms
Substances
LinkOut - more resources
Full Text Sources
Other Literature Sources
Miscellaneous
