. 2010 Dec 2;116(23):4938-47.
doi: 10.1182/blood-2009-10-246439. Epub 2010 Aug 19.

Olfactomedin 4 is a novel target gene of retinoic acids and 5-aza-2'-deoxycytidine involved in human myeloid leukemia cell growth, differentiation, and apoptosis

Affiliations

Olfactomedin 4 is a novel target gene of retinoic acids and 5-aza-2'-deoxycytidine involved in human myeloid leukemia cell growth, differentiation, and apoptosis

Wenli Liu et al. Blood. .

Abstract

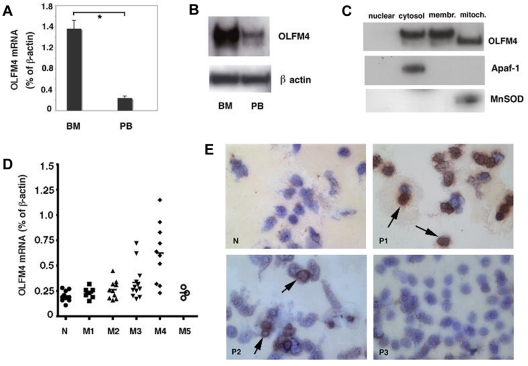
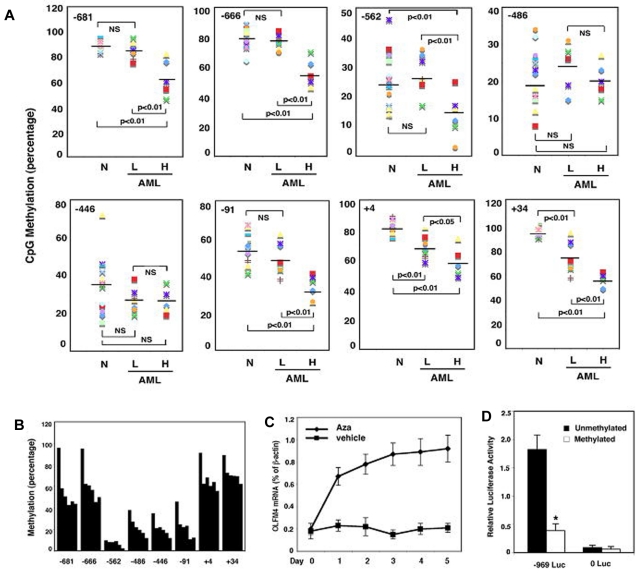
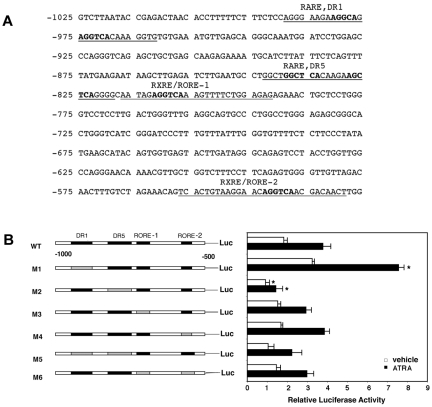
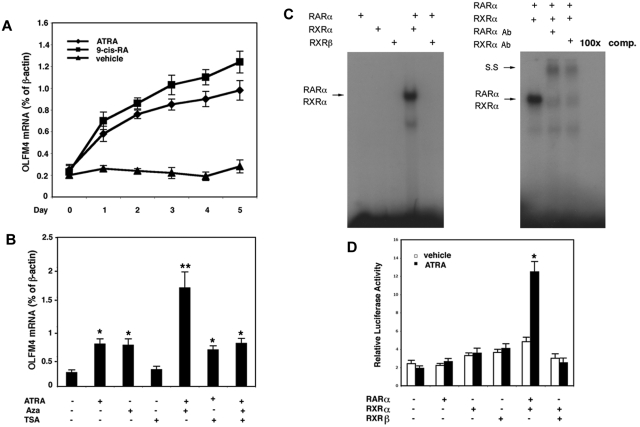
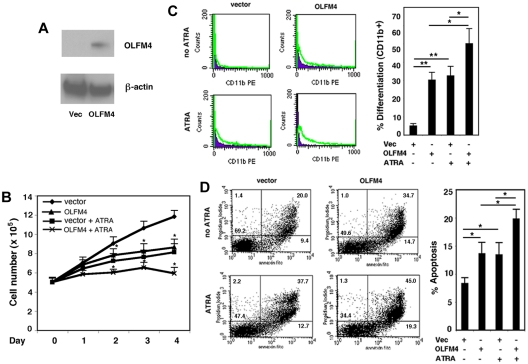
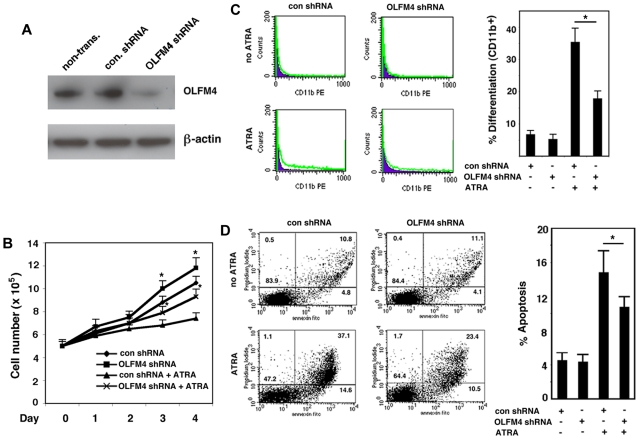
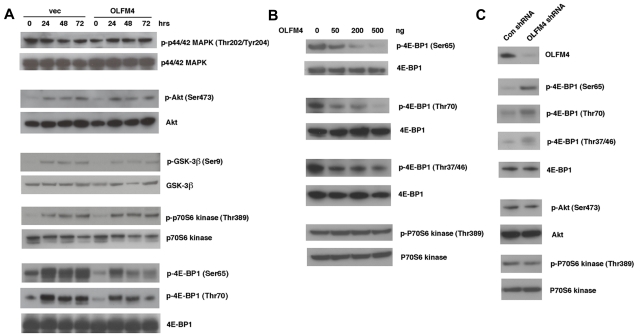
Clinical application of retinoic acids (RAs) and demethylation agents has proven to be effective in treating certain myeloid leukemia patients. However, the target genes that mediate these antileukemia activities are still poorly understood. In this study, we identified olfactomedin 4 (OLFM4), a myeloid-lineage-specific gene from the olfactomedin family, as a novel target gene for RAs and the demethylation agent, 5-aza-2'-deoxycytidine. We demonstrated that the retinoic acid receptor alpha/retinoic X receptor alpha heterodimer binds to a retinoic acid response-element (DR5) site in the OLFM4 promoter and mediates all-trans-retinoic acid (ATRA)-induced transactivation of the OLFM4 gene. OLFM4 overexpression in HL-60 cells led to growth inhibition, differentiation, and apoptosis, and potentiated ATRA induction of these effects. Conversely, down-regulation of endogenous OLFM4 in acute myeloid leukemia-193 cells compromised ATRA-induced growth inhibition, differentiation, and apoptosis. Overexpression of OLFM4 in HL-60 cells inhibited constitutive and ATRA-induced phosphorylation of the eukaryote initiation factor 4E-binding protein 1 (4E-BP1), whereas down-regulation of OLFM4 protein in acute myeloid leukemia-193 cells increased 4E-BP1 phosphorylation, suggesting that OLFM4 is a potent upstream inhibitor of 4E-BP1 phosphorylation/deactivation. Thus, our study demonstrates that OLFM4 plays an important role in myeloid leukemia cellular functions and induction of OLFM4-mediated effects may contribute to the therapeutic value of ATRA.


Figures

Figure 1
Figure 1
Up-regulation of OLFM4 in a subset of AML patients. (A) OLFM4 mRNA expression in human bone marrow (BM) and peripheral blood (PB) neutrophils from normal individuals, as determined by qRT-PCR. OLFM4 expression is shown relative to β-actin mRNA expression. *P < .01. (B) OLFM4 protein expression in BM and PB neutrophils from normal individuals, as determined by Western blot analysis. β-actin expression was used as a loading control. (C) OLFM4 protein expression in subcellular fractions of human BM neutrophils from normal individuals, as determined by Western blot analysis. Expressions of Apaf-1 and MnSOD were used to confirm the identity of the cytosolic and mitochondria fractions, respectively. (D) OLFM4 expression in peripheral blood leukocytes from M1 (n = 7), M2 (n = 10), M3 (n = 12), M4 (n = 10), or M5 (n = 3) subtypes of acute myeloid leukemia (AML) patients and normal individuals (N, n = 10) was analyzed by qRT-PCR. The bar represents the mean level of OLFM4 expression relative to β-actin expression. The values in the M4 group is significantly different from each of the other groups using 1-way ANOVA analysis, followed by Bonferroni multiple comparison test; P < .05. (E) Peripheral blood mononuclear cells from a normal individual (N), and 3 AML patients (P1 [M4 subtype], P2 [M3 subtype], and P3 [M1 subtype]) were immunostained with OLFM4 antibody (1:100) and counterstained with Giemsa. Brown color (arrows) indicates the OLFM4-positive cells.
Figure 2
Figure 2
OLFM4 promoter CpG methylation status in AML patients and effect of 5-aza-2′-deoxycytidine on OLFM4 transcription in HL-60 cells. (A) Methylation status (percentage) of 8 CpG sites (−681, −666, −562, −486, −446, −91, +4, and +34, relative to the OLFM4 transcription start site) in the OLFM4 promoter in the DNA isolated from the peripheral blood leukocytes of AML patients. Methylation levels in AML patients with low OLFM4 mRNA expression (L, n = 7), AML patients with high OLFM4 mRNA expression (H, n = 5), and normal individuals (N, n = 10) were measured with pyrosequence. (B) Methylation (percentage) of the 8 CpG sites in the OLFM4 promoter of HL-60 cells was determined with pyrosequence. Each bar (from left to right) in every CpG site group represents 5-aza-2′-deoxycytidine (5μM) treatment for days 0, 1, 2, 3, 4, and 5. Medium was replaced with new medium with freshly added 5-aza-2′-deoxycytidine every 48 hours. (C) HL-60 cells were treated with 5-aza-2′-deoxycytidine (Aza, 5μM) or vehicle for 5 days. Medium was replaced with new medium with freshly added 5-aza-2′-deoxycytidine or vehicle every 48 hours. OLFM4 expression was determined by qRT-PCR. Values relative to β-actin represent the mean ± SD of 3 experiments performed in triplicate. (D) Promoter activity of the 5′-flanking region of the OLFM4 gene (−969 Luc) in HL-60 cells transfected with OLFM4 promoter-reporter constructs that were treated with or without Sss I CpG methylase. 0 Luc represents parental luciferase reporter construct without the OLFM4 promoter. Data represent the relative activities to the Renilla luciferase activities of phRL-TK, which was transfected together with each OLFM4 plasmid construct. Values represent the mean ± SD of 3 experiments performed in triplicate. *P < .05, compared with unmethylated promoter.
Figure 3
Figure 3
Identification of a positive and a negative RARE in the OLFM4 promoter. (A) The potential retinoic acid responsive elements (RAREs) and retinoid X responsive elements (RXREs) binding sites identified by Genomatix software in the proximal promoter of the OLFM4 gene are underlined. The bold characters represent nucleotides that were deleted. (B) OLFM4 promoter activity in HL-60 cells transfected with various promoter constructs and then treated with either vehicle or ATRA. Luciferase reporter activities of OLFM4 promoter with serial RARE or RXRE/RORE deletions were analyzed with a dual-reporter system. The black boxes represent RARE or RXRE/RORE binding sites. The gray boxes represent corresponding deleted sites. Values were normalized to Renilla luciferase internal controls. Data represent the mean ± SD of 3 independent experiments performed in triplicates. *P < .05, compared with corresponding wild-type (WT)–Luc control.
Figure 4
Figure 4
ATRA induces OLFM4 expression and transactivation of the OLFM4 promoter by RARα/RXRα heterodimer. (A) HL-60 cells were treated with ATRA (1μM), 9-cis-RA (1μM), or vehicle control for 5 days. Medium was replaced with new medium with freshly added RAs or vehicle every 48 hours. OLFM4 mRNA expression relative to β-actin expression was determined by qRT-PCR. (B) HL-60 cells were treated with ATRA (1μM), 5-aza-2′-deoxycytidine (Aza, 5μM), or trichostatin A (TSA, 1μM) alone or in combination for 2 days. OLFM4 mRNA expression relative to β-actin expression was determined by qRT-PCR. *P < .05, **P < .01, when compared with vehicle treatment. (C) Left panel: in vitro–transcribed and –translated RAR-α, RXR-α, or RXR-β protein alone or in combination was incubated with γ-32P-labeled RARE-DR5 probe of the OLFM4 promoter, then analyzed by electrophoretic mobility-shift assay. Right panel: the in vitro–transcribed and –translated RAR-α and RXR-α protein mixture was incubated with RARE-DR5 probe and subjected to electrophoretic mobility-shift assay. SS indicates supershift band. 100× comp, 100× cold-probe competitions. (D) COS-7 cells were cotransfected for 48 hours with the OLFM4 promoter, luciferase-reporter plasmid (OLFM4-Luc, −959), phRL-TK vector, and expression vectors expressing no cDNA (leftmost set of bars), RAR-α, RXR-α, RXR-β, or combinations of cDNA, as indicated. For the last 24 hours, the cells were treated with 1μM ATRA or vehicle control, then luciferase activities in cell extracts were determined. Values represent the OLFM4 promoter activity relative to TK activity (Renilla luciferase as internal control). Data represent the mean ± SD of 3 independent experiments performed in triplicate. *P < .05, compared with empty vector (no cDNA: leftmost set of bars).
Figure 5
Figure 5
Effect of OLFM4 overexpression on HL-60 cell growth, differentiation, and apoptosis. (A) The cell lysates of HL-60 cells transfected with either OLFM4 expression vector or empty vector (Vec) were subjected to Western blotting analysis with OLFM4 antibody, then stripped and reprobed with β-actin antibody. (B) HL-60 cells were transfected with either OLFM4 expression plasmid or empty vector, then stably transfected cells were treated with ATRA (1μM) or vehicle for 4 days. Cell numbers were counted with trypan blue exclusion. Data represent the mean ± SD of 3 independent experiments *P < .05, when OLFM4 was compared with vector, and when OLFM4 + ATRA was compared with vector + ATRA. (C) Stably transfected HL-60 cells were treated with ATRA (1μM) or vehicle for 4 days. The expression of CD11b was analyzed by flow cytometry. A representative experiment is shown in the left panel, and the percentage of CD11b+ cells is presented in the right panel. Data represent mean ± SD of 3 independent experiments. *P < .05, **P < .01. (D) Stably transfected HL-60 cells were treated with ATRA (1μM) or vehicle for 4 days. Cell apoptosis was analyzed with annexin V–propidium iodide staining using flow cytometry. A representative analysis data are shown in the left panel, and the percentage of apoptotic cells is shown in the right panel. Data represent the mean ± SD of 3 independent experiments. *P < .05.
Figure 6
Figure 6
Effect of OLFM4 shRNA on ATRA-mediated AML-193 cell growth, differentiation, and apoptosis. (A) AML-193 cells were transduced with lentiviral OLFM4 shRNA or control shRNA, and puromycin-resistant cell populations were selected. Blots of cell lysates were subjected to Western blotting with OLFM4 antibody, then stripped and reprobed with β-actin antibody. (B) Puromycin-enriched AML-193 cells transduced with OLFM4 shRNA or control shRNA were treated with ATRA (1μM) or vehicle for 4 days. Cell numbers were counted with trypan blue exclusion. Data represent the mean ± SD of 3 independent experiments. *P < .05, when OLFM4 shRNA was compared with control shRNA, and when OLFM4 shRNA + ATRA was compared with control shRNA + ATRA. (C) Puromycin-resistant AML-193 cells transduced with OLFM4 shRNA or control shRNA were treated with ATRA (1μM) or vehicle for 4 days. The expression of CD11b was analyzed by flow cytometry. A representative experiment is shown in the left panel, and the percentage of CD11b+ cells is presented in the right panel. Data represent the mean ± SD of 3 independent experiments. *P < .05. (D) Puromycin-resistant AML-193 cells transduced with OLFM4 shRNA or control shRNA were treated with ATRA (1μM) or vehicle for 4 days. Cell apoptosis was analyzed with annexin V–propidium iodide staining using flow cytometry. A representative analysis is shown in the left panel, and the percentage of apoptotic cells is shown in the right panel. Data represent the mean ± SD of 3 independent experiments. *P < .05.
Figure 7
Figure 7
OLFM4 inhibits 4E-BP1 phosphorylation. (A) HL-60 cells were transfected with OLFM4 expression plasmid (OLFM4) or empty vector (vec) and selected by G418. G418-resistant HL-60 cells were treated with ATRA (1μM) for 3 days. Total cell lysates were subjected to Western blotting analysis with antibodies for phospho-p44/42 MAPK (Thr202/Tyr204), phospho-Akt (Ser473), phospho-GSK3β (Ser9), phopho-p70S6 kinase (Thr389), and phospho-4E-BP1 (Ser65 or Thr70). The blots were stripped and reprobed with corresponding antibodies for p44/42 MAPK, Akt, GSK-3β, p70S6 kinase, and 4E-BP1. (B) HEK-293T cells were cotransfected with 4E-BP1 or p70S6 kinase expression plasmid together with OLFM4 expression plasmid in different amounts, as indicated. After 24 hours, total cell lysates were subjected to Western blotting analysis with antibodies for phospho-4E-BP1 (Ser65, Thr70, or Thr37/46) or phospho-p70S6 kinase (Thr389). The blots were stripped and reprobed with total anti–4E-BP1 or anti-p70S6 kinase. (C) AML-193 cells were transduced with lentiviral shRNA against OLFM4 or control shRNA. After 48 hours, total cell lysates were subjected to Western blotting analysis with antibodies for OLFM4, phospho-4E-BP1 (Ser65, Thr70, or Thr37/46), phospho-Akt (Ser473), or phospho-p70S6 kinase (Thr389). The blots were stripped and reprobed with corresponding 4E-BP1, Akt, and p70S6 kinase antibodies.

Similar articles

Cited by

References

    1. Huang ME, Ye YC, Chen SR, et al. Use of all-trans retinoic acid in the treatment of acute promyelocytic leukemia. Blood. 1988;72(2):567–572. - PubMed
    1. Tallman MS, Andersen JW, Schiffer CA, et al. All-trans retinoic acid in acute promyelocytic leukemia: long-term outcome and prognostic factor analysis from the North American Intergroup protocol. Blood. 2002;100(13):4298–4302. - PubMed
    1. Lubbert M. DNA methylation inhibitors in the treatment of leukemias, myelodysplastic syndromes, and hemoglobinopathies: clinical results and possible mechanisms of action. Curr Top Microbiol Immunol. 2000;249:135–164. - PubMed
    1. Soriano AO, Yang H, Faderl S, et al. Safety and clinical activity of the combination of 5-azacytidine, valproic acid, and all-trans retinoic acid in acute myeloid leukemia and myelodysplastic syndrome. Blood. 2007;110(7):2302–2308. - PubMed
    1. Zhang J, Liu WL, Tang DC, et al. Identification and characterization of a novel member of olfactomedin-related protein family, hGC-1, expressed during myeloid lineage development. Gene. 2002;283(1-2):83–93. - PubMed

Publication types

MeSH terms