

Linear arrays of nuclear envelope proteins harness retrograde actin flow for nuclear movement
- PMID: 20724637
- PMCID: PMC3938394
- DOI: 10.1126/science.1189072
Linear arrays of nuclear envelope proteins harness retrograde actin flow for nuclear movement
Abstract
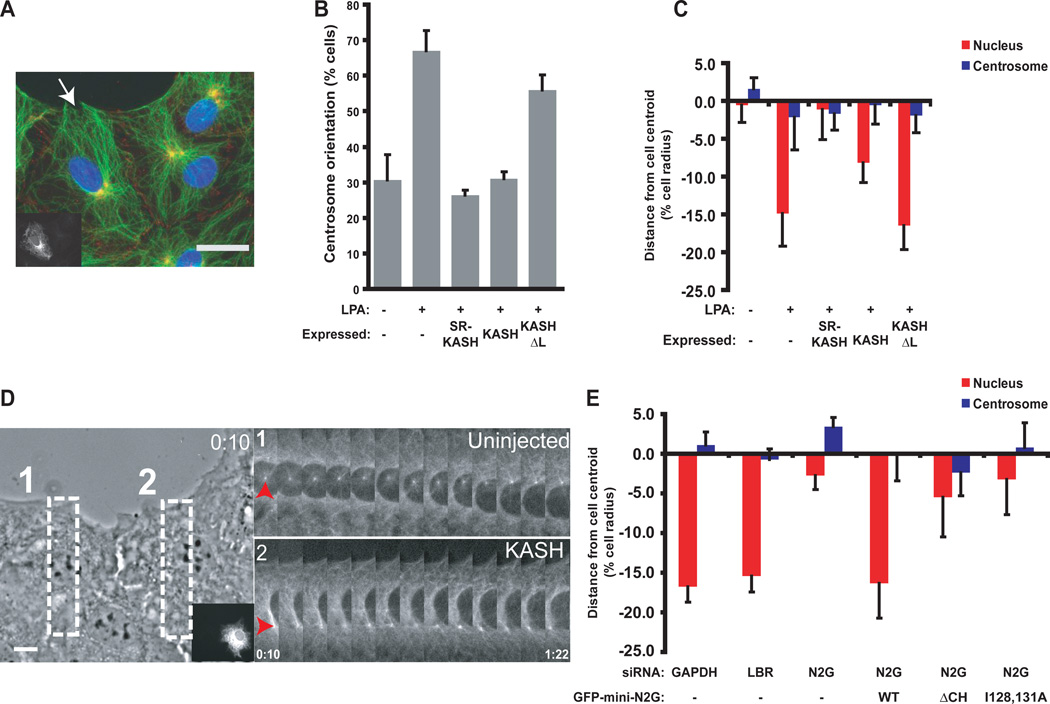
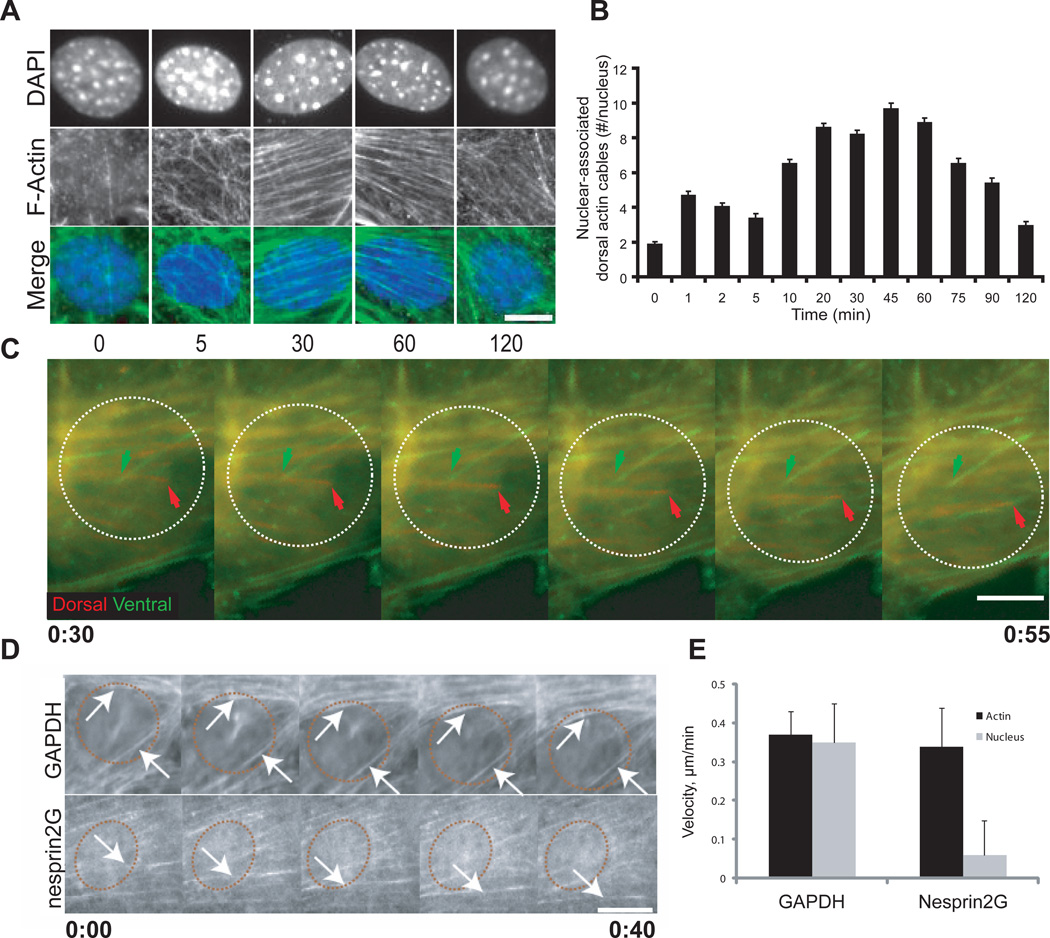
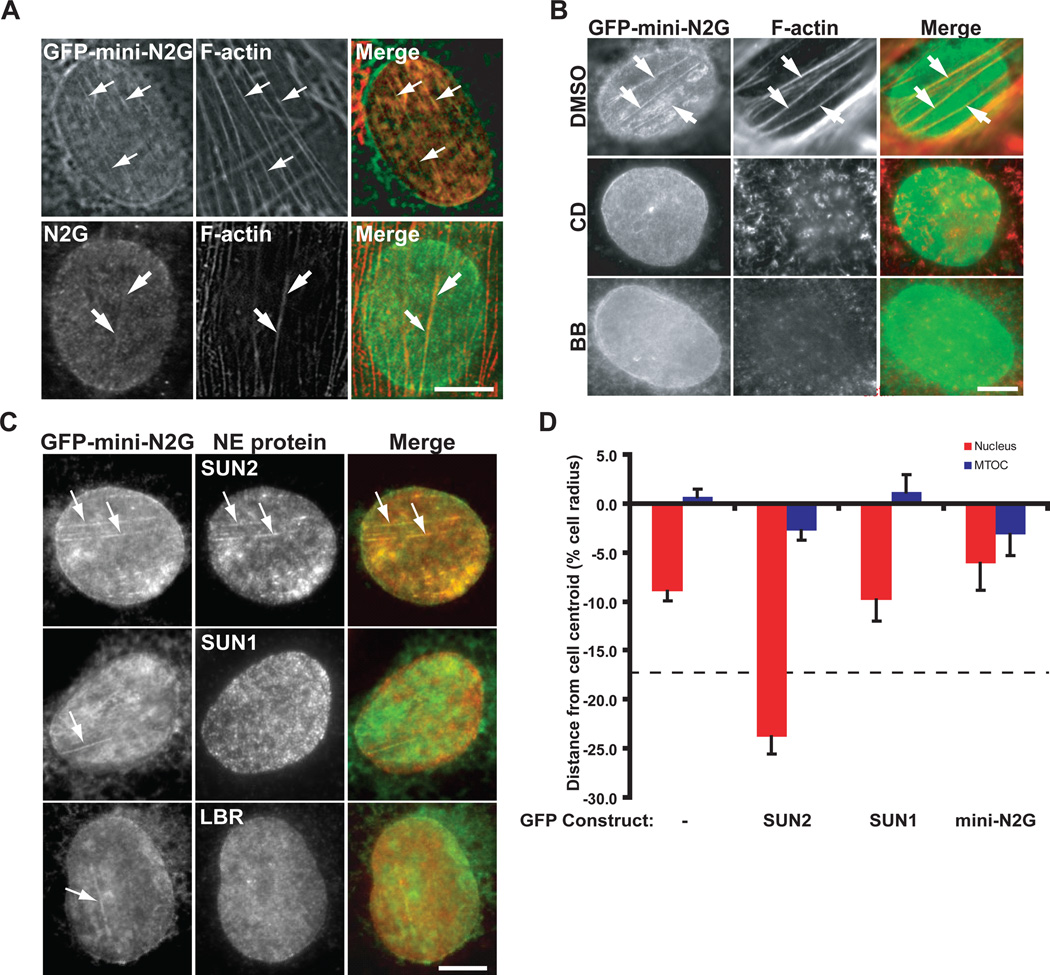
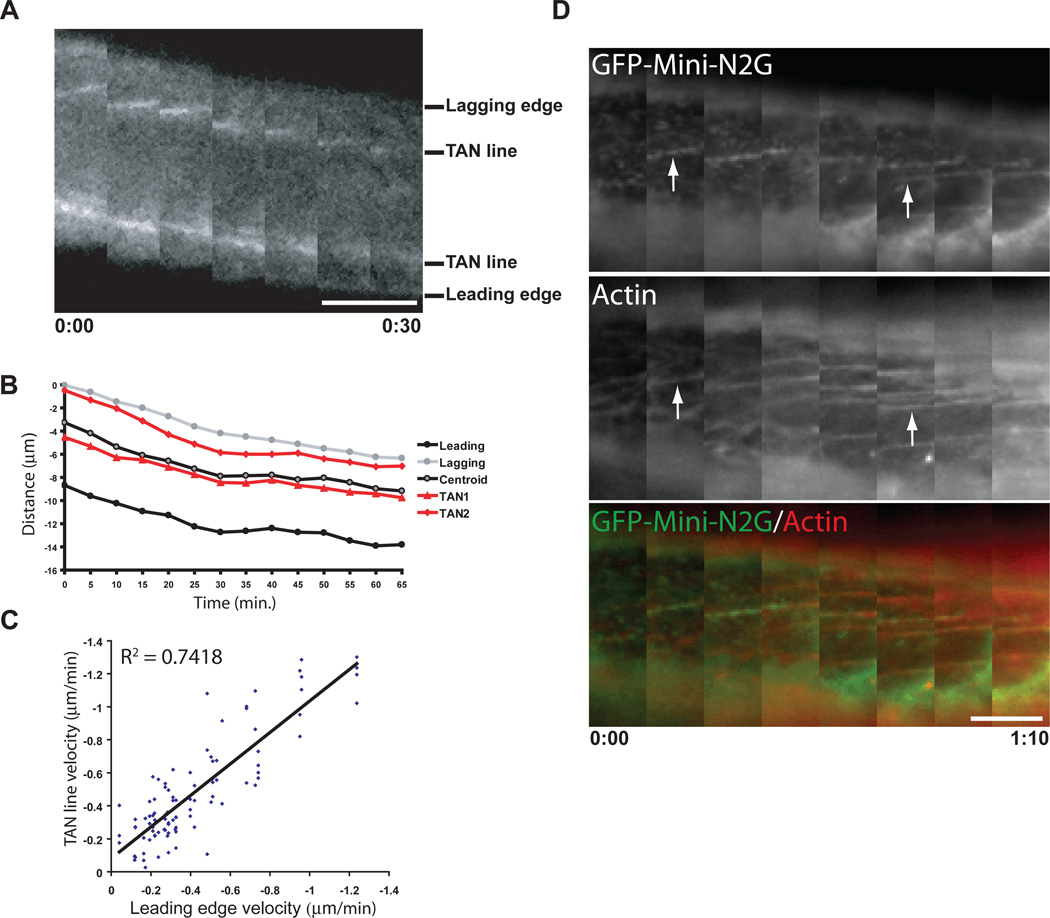
Nuclei move to specific locations to polarize migrating and differentiating cells. Many nuclear movements are microtubule-dependent. However, nuclear movement to reorient the centrosome in migrating fibroblasts occurs through an unknown actin-dependent mechanism. We found that linear arrays of outer (nesprin2G) and inner (SUN2) nuclear membrane proteins assembled on and moved with retrogradely moving dorsal actin cables during nuclear movement in polarizing fibroblasts. Inhibition of nesprin2G, SUN2, or actin prevented nuclear movement and centrosome reorientation. The coupling of actin cables to the nuclear membrane for nuclear movement via specific membrane proteins indicates that, like plasma membrane integrins, nuclear membrane proteins assemble into actin-dependent arrays for force transduction.
Figures
Comment in
-
Cell biology. Nuclei get TAN lines.Science. 2010 Aug 20;329(5994):909-10. doi: 10.1126/science.1194562. Science. 2010. PMID: 20724623 No abstract available.
Similar articles
-
Emerin organizes actin flow for nuclear movement and centrosome orientation in migrating fibroblasts.Mol Biol Cell. 2013 Dec;24(24):3869-80. doi: 10.1091/mbc.E13-06-0307. Epub 2013 Oct 23. Mol Biol Cell. 2013. PMID: 24152738 Free PMC article.
-
TorsinA controls TAN line assembly and the retrograde flow of dorsal perinuclear actin cables during rearward nuclear movement.J Cell Biol. 2017 Mar 6;216(3):657-674. doi: 10.1083/jcb.201507113. Epub 2017 Feb 27. J Cell Biol. 2017. PMID: 28242745 Free PMC article.
-
Lamin A variants that cause striated muscle disease are defective in anchoring transmembrane actin-associated nuclear lines for nuclear movement.Proc Natl Acad Sci U S A. 2011 Jan 4;108(1):131-6. doi: 10.1073/pnas.1000824108. Epub 2010 Dec 20. Proc Natl Acad Sci U S A. 2011. PMID: 21173262 Free PMC article.
-
Nuclear envelope organization in Dictyostelium discoideum.Int J Dev Biol. 2019;63(8-9-10):509-519. doi: 10.1387/ijdb.190184rg. Int J Dev Biol. 2019. PMID: 31840788 Review.
-
Connecting the nucleus to the cytoskeleton by SUN-KASH bridges across the nuclear envelope.Curr Opin Cell Biol. 2013 Feb;25(1):57-62. doi: 10.1016/j.ceb.2012.10.014. Epub 2012 Nov 10. Curr Opin Cell Biol. 2013. PMID: 23149102 Free PMC article. Review.
Cited by
-
Quantitative Phase Imaging of Spreading Fibroblasts Identifies the Role of Focal Adhesion Kinase in the Stabilization of the Cell Rear.Biomolecules. 2020 Jul 22;10(8):1089. doi: 10.3390/biom10081089. Biomolecules. 2020. PMID: 32707896 Free PMC article.
-
The LINC-anchored actin cap connects the extracellular milieu to the nucleus for ultrafast mechanotransduction.Sci Rep. 2013;3:1087. doi: 10.1038/srep01087. Epub 2013 Jan 18. Sci Rep. 2013. PMID: 23336069 Free PMC article.
-
Nuclear positioning.Cell. 2013 Mar 14;152(6):1376-89. doi: 10.1016/j.cell.2013.02.031. Cell. 2013. PMID: 23498944 Free PMC article. Review.
-
Viscoelasticity, Like Forces, Plays a Role in Mechanotransduction.Front Cell Dev Biol. 2022 Feb 9;10:789841. doi: 10.3389/fcell.2022.789841. eCollection 2022. Front Cell Dev Biol. 2022. PMID: 35223831 Free PMC article. Review.
-
In silico analysis shows that dynamic changes in curvature guide cell migration over long distances.Biomech Model Mechanobiol. 2024 Feb;23(1):315-333. doi: 10.1007/s10237-023-01777-4. Epub 2023 Oct 24. Biomech Model Mechanobiol. 2024. PMID: 37875692
References
Publication types
MeSH terms
Substances
Grants and funding
LinkOut - more resources
Full Text Sources
Other Literature Sources
Molecular Biology Databases
Miscellaneous
