

Alcohol retail density and demographic predictors of health disparities: a geographic analysis
- PMID: 20724696
- PMCID: PMC2936987
- DOI: 10.2105/AJPH.2009.170464
Alcohol retail density and demographic predictors of health disparities: a geographic analysis
Abstract
Objectives: We examined whether the geographic density of alcohol retailers was greater in geographic areas with higher levels of demographic characteristics that predict health disparities.
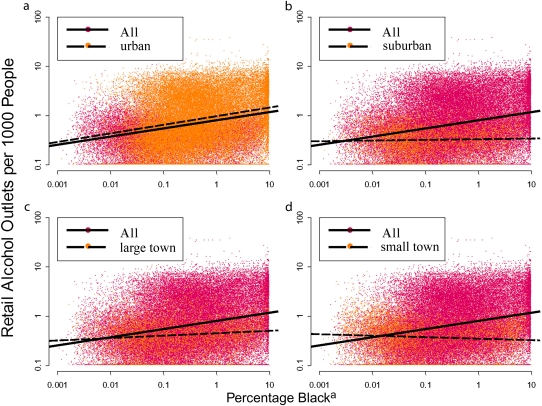
Methods: We obtained the locations of all alcohol retailers in the continental United States and created a map depicting alcohol retail outlet density at the US Census tract level. US Census data provided tract-level measures of poverty, education, crowding, and race/ethnicity. We used multiple linear regression to assess relationships between these variables and retail alcohol density.
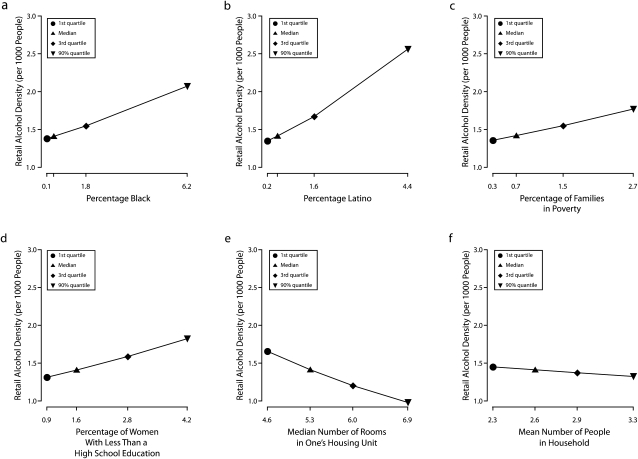
Results: In urban areas, retail alcohol density had significant nonlinear relationships with Black race, Latino ethnicity, poverty, and education, with slopes increasing substantially throughout the highest quartile for each predictor. In high-proportion Latino communities, retail alcohol density was twice as high as the median density. Retail alcohol density had little or no relationship with the demographic factors of interest in suburban, large town, or rural census tracts.
Conclusions: Greater density of alcohol retailers was associated with higher levels of poverty and with higher proportions of Blacks and Latinos in urban census tracts. These disparities could contribute to higher morbidity in these geographic areas.
Figures
References
-
- Romley JA, Cohen D, Ringel J, Sturm R. Alcohol and environmental justice: the density of liquor stores and bars in urban neighborhoods in the United States. J Stud Alcohol Drugs. 2007;68(1):48–55 - PubMed
-
- Gliksman L, Rush BR. Alcohol availability, alcohol consumption and alcohol-related damage. II. The role of sociodemographic factors. J Stud Alcohol. 1986;47(1):11–18 - PubMed
-
- Freisthler B, Gruenewald PJ, Rerner LG, Lery B, Needell B. Exploring the spatial dynamics of alcohol outlets and child protective services referrals, substantiations, and foster care entries. Child Maltreat. 2007;12(2):114–124 - PubMed
-
- Kuntsche E, Kuendig H, Gmel G. Alcohol outlet density, perceived availability and adolescent alcohol use: a multilevel structural equation model. J Epidemiol Community Health. 2008;62(9):811–816 - PubMed
Publication types
MeSH terms
Grants and funding
LinkOut - more resources
Full Text Sources
