Radiation dose optimized lateral expansion of the field of view in synchrotron radiation X-ray tomographic microscopy
- PMID: 20724780
- PMCID: PMC2927902
- DOI: 10.1107/S0909049510019618
Radiation dose optimized lateral expansion of the field of view in synchrotron radiation X-ray tomographic microscopy
Abstract
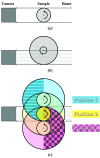
Volumetric data at micrometer level resolution can be acquired within a few minutes using synchrotron-radiation-based tomographic microscopy. The field of view along the rotation axis of the sample can easily be increased by stacking several tomograms, allowing the investigation of long and thin objects at high resolution. On the contrary, an extension of the field of view in the perpendicular direction is non-trivial. This paper presents an acquisition protocol which increases the field of view of the tomographic dataset perpendicular to its rotation axis. The acquisition protocol can be tuned as a function of the reconstruction quality and scanning time. Since the scanning time is proportional to the radiation dose imparted to the sample, this method can be used to increase the field of view of tomographic microscopy instruments while optimizing the radiation dose for radiation-sensitive samples and keeping the quality of the tomographic dataset on the required level. This approach, dubbed wide-field synchrotron radiation tomographic microscopy, can increase the lateral field of view up to five times. The method has been successfully applied for the three-dimensional imaging of entire rat lung acini with a diameter of 4.1 mm at a voxel size of 1.48 microm.
Figures


 , blue diamonds) for the 19 scanned protocols overlaid over quality-plot (red dots) obtained from the simulation (described in §2.4). The normalized error has been calculated using the difference image of each protocol i with protocol B. The error bars for each protocol show the standard deviation of the error calculated for 205 of the 1024 slices. Note that the scale of the error was normalized to 20–100%, so that both the quality from the simulation and the error are directly comparable. The abscissa shows the scanning time in percentage of time used for the gold standard scan. Protocol T on the far left corresponds to the fastest scanning time, protocol B on the far right to the slowest. The protocols in between are shown from T–B for increasing percentage of the scanning time.


Similar articles
-
Image processing pipeline for synchrotron-radiation-based tomographic microscopy.J Synchrotron Radiat. 2010 Jul;17(4):550-9. doi: 10.1107/S0909049510011830. Epub 2010 May 14. J Synchrotron Radiat. 2010. PMID: 20567088
-
Micrometer-resolution X-ray tomographic full-volume reconstruction of an intact post-mortem juvenile rat lung.Histochem Cell Biol. 2021 Feb;155(2):215-226. doi: 10.1007/s00418-020-01868-8. Epub 2020 Mar 18. Histochem Cell Biol. 2021. PMID: 32189111 Free PMC article.
-
Finite element 3D reconstruction of the pulmonary acinus imaged by synchrotron X-ray tomography.J Appl Physiol (1985). 2008 Sep;105(3):964-76. doi: 10.1152/japplphysiol.90546.2008. Epub 2008 Jun 26. J Appl Physiol (1985). 2008. PMID: 18583378 Free PMC article.
-
Functional lung imaging with synchrotron radiation: Methods and preclinical applications.Phys Med. 2020 Nov;79:22-35. doi: 10.1016/j.ejmp.2020.10.001. Epub 2020 Oct 15. Phys Med. 2020. PMID: 33070047 Review.
-
High resolution imaging in bone tissue research-review.Bone. 2021 Feb;143:115620. doi: 10.1016/j.bone.2020.115620. Epub 2020 Aug 29. Bone. 2021. PMID: 32866682 Review.
Cited by
-
36M-pixel synchrotron radiation micro-CT for whole secondary pulmonary lobule visualization from a large human lung specimen.Eur J Radiol Open. 2020 Sep 12;7:100262. doi: 10.1016/j.ejro.2020.100262. eCollection 2020. Eur J Radiol Open. 2020. PMID: 32984451 Free PMC article.
-
Visualization of protein crystals by high-energy phase-contrast X-ray imaging.Acta Crystallogr D Struct Biol. 2019 Nov 1;75(Pt 11):947-958. doi: 10.1107/S2059798319011379. Epub 2019 Oct 31. Acta Crystallogr D Struct Biol. 2019. PMID: 31692469 Free PMC article.
-
Particle transport and deposition: basic physics of particle kinetics.Compr Physiol. 2013 Oct;3(4):1437-71. doi: 10.1002/cphy.c100085. Compr Physiol. 2013. PMID: 24265235 Free PMC article. Review.
-
Tenascin-C deficiency impairs alveolarization and microvascular maturation during postnatal lung development.J Appl Physiol (1985). 2020 May 1;128(5):1287-1298. doi: 10.1152/japplphysiol.00258.2019. Epub 2020 Feb 20. J Appl Physiol (1985). 2020. PMID: 32078464 Free PMC article.
-
Synchrotron-based X-ray tomographic microscopy for visualization of three-dimensional collagen matrices.Clin Oral Investig. 2015 Mar;19(2):561-4. doi: 10.1007/s00784-014-1312-4. Epub 2014 Sep 11. Clin Oral Investig. 2015. PMID: 25209594
References
-
- Danielsson, P. (1980). Comput. Graph. Image Process.14, 6–8.
-
- Dowd, B. A., Campbell, G. H., Marr, R. B., Nagarkar, V. V., Tipnis, S. V., Axe, L. & Siddons, D. P. (1999). Proc. SPIE, 3772, 224–236.
-
- Hintermüller, C., Marone, F., Isenegger, A. & Stampanoni, M. (2010). J. Synchrotron Rad.17, 550–559. - PubMed
-
- Kak, A. C. & Slaney, M. (1988). Principles of Computerized Tomographic Imaging. New York: IEEE Press.
-
- Kohn, H. N. (1893). München. Med. Wochenschr.40, 42–45.
Publication types
MeSH terms
LinkOut - more resources
Full Text Sources

