

Clusters, factories and domains: The complex structure of S-phase comes into focus
- PMID: 20724827
- PMCID: PMC3041163
- DOI: 10.4161/cc.9.16.12644
Clusters, factories and domains: The complex structure of S-phase comes into focus
Abstract
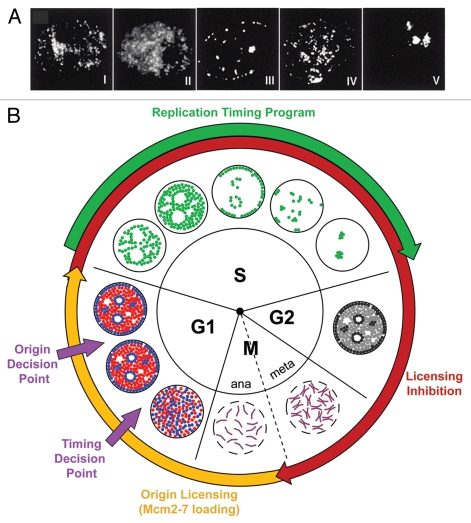
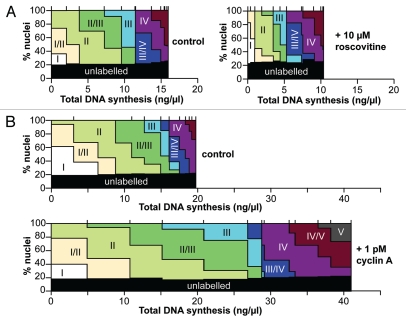
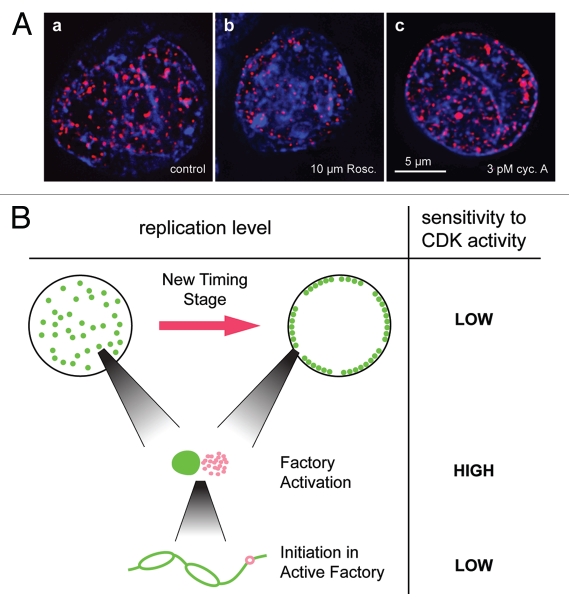
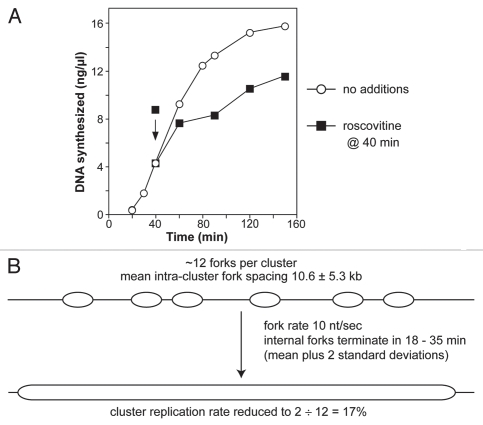
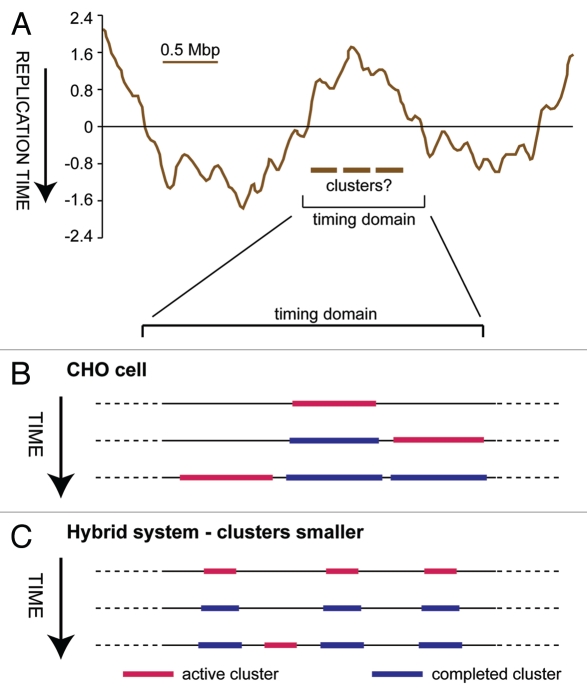
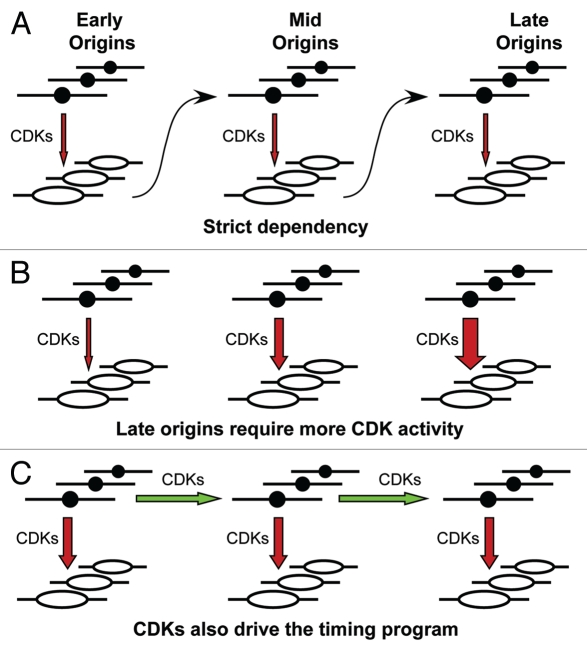
During S-phase of the cell cycle, chromosomal DNA is replicated according to a complex replication timing program, with megabase-sized domains replicating at different times. DNA fibre analysis reveals that clusters of adjacent replication origins fire near-synchronously. Analysis of replicating cells by light microscopy shows that DNA synthesis occurs in discrete foci or factories. The relationship between timing domains, origin clusters and replication foci is currently unclear. Recent work, using a hybrid Xenopus/hamster replication system, has shown that when CDK levels are manipulated during S-phase the activation of replication factories can be uncoupled from progression through the replication timing program. Here, we use data from this hybrid system to investigate potential relationships between timing domains, origin clusters and replication foci. We suggest that each timing domain typically comprises several replicon clusters, which are usually processed sequentially by replication factories. We discuss how replication might be regulated at different levels to create this complex organisation and the potential involvement of CDKs in this process.
Figures

Similar articles
-
Replication factory activation can be decoupled from the replication timing program by modulating Cdk levels.J Cell Biol. 2010 Jan 25;188(2):209-21. doi: 10.1083/jcb.200911037. Epub 2010 Jan 18. J Cell Biol. 2010. PMID: 20083602 Free PMC article.
-
DNA replication timing is deterministic at the level of chromosomal domains but stochastic at the level of replicons in Xenopus egg extracts.Nucleic Acids Res. 2008 Oct;36(17):5623-34. doi: 10.1093/nar/gkn533. Epub 2008 Sep 2. Nucleic Acids Res. 2008. PMID: 18765475 Free PMC article.
-
Evidence for a mammalian late-G1 phase inhibitor of replication licensing distinct from geminin or Cdk activity.Nucleus. 2011 Sep-Oct;2(5):455-64. doi: 10.4161/nucl.2.5.17859. Epub 2011 Sep 1. Nucleus. 2011. PMID: 21983086 Free PMC article.
-
Nuclear matrix support of DNA replication.J Cell Biochem. 2005 Dec 1;96(5):951-61. doi: 10.1002/jcb.20610. J Cell Biochem. 2005. PMID: 16167334 Review.
-
Control of DNA replication licensing in a cell cycle.Genes Cells. 2002 Jun;7(6):523-34. doi: 10.1046/j.1365-2443.2002.00544.x. Genes Cells. 2002. PMID: 12059957 Review.
Cited by
-
The genome in space and time: does form always follow function? How does the spatial and temporal organization of a eukaryotic genome reflect and influence its functions?Bioessays. 2012 Sep;34(9):800-10. doi: 10.1002/bies.201200034. Epub 2012 Jul 6. Bioessays. 2012. PMID: 22777837 Free PMC article.
-
Dynamics of plant DNA replication based on PCNA visualization.Sci Rep. 2016 Jul 15;6:29657. doi: 10.1038/srep29657. Sci Rep. 2016. PMID: 27417498 Free PMC article.
-
The location and development of Replicon Cluster Domains in early replicating DNA.Wellcome Open Res. 2023 Aug 22;8:158. doi: 10.12688/wellcomeopenres.18742.2. eCollection 2023. Wellcome Open Res. 2023. PMID: 37766844 Free PMC article.
-
Outer kinetochore protein Dam1 promotes centromere clustering in parallel with Slk19 in budding yeast.Chromosoma. 2019 Jun;128(2):133-148. doi: 10.1007/s00412-019-00694-9. Epub 2019 Mar 12. Chromosoma. 2019. PMID: 30903360
-
Safeguarding genome integrity: the checkpoint kinases ATR, CHK1 and WEE1 restrain CDK activity during normal DNA replication.Nucleic Acids Res. 2012 Jan;40(2):477-86. doi: 10.1093/nar/gkr697. Epub 2011 Sep 21. Nucleic Acids Res. 2012. PMID: 21937510 Free PMC article. Review.
References
-
- Goren A, Cedar H. Replicating by the clock. Nat Rev Mol Cell Biol. 2003;4:4–6. - PubMed
-
- Zink D. The temporal program of DNA replication: new insights into old questions. Chromosoma. 2006;115:273–287. - PubMed
-
- Dimitrova DS, Gilbert DM. The spatial position and replication timing of chromosomal domains are both established in early G1 phase. Mol Cell. 1999;4:983–993. - PubMed
Publication types
MeSH terms
Substances
Grants and funding
- S10310/BB_/Biotechnology and Biological Sciences Research Council/United Kingdom
- C303/A7399/CRUK_/Cancer Research UK/United Kingdom
- C303/A5434/CRUK_/Cancer Research UK/United Kingdom
- BB/H013024/1/BB_/Biotechnology and Biological Sciences Research Council/United Kingdom
- BB/013024/1/BB_/Biotechnology and Biological Sciences Research Council/United Kingdom
LinkOut - more resources
Full Text Sources