Review
. 2010 Oct;10(5):427-33.
doi: 10.1097/ACI.0b013e32833de6ee.

Genomewide association studies in allergy and the influence of ethnicity

Affiliations
Review

Genomewide association studies in allergy and the influence of ethnicity

Kathleen C Barnes. Curr Opin Allergy Clin Immunol. 2010 Oct.

Abstract

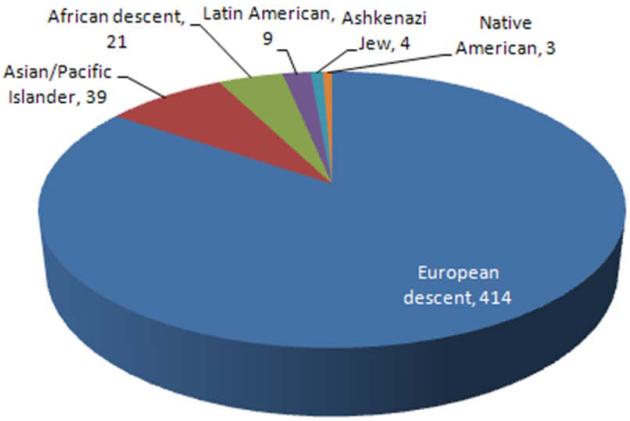
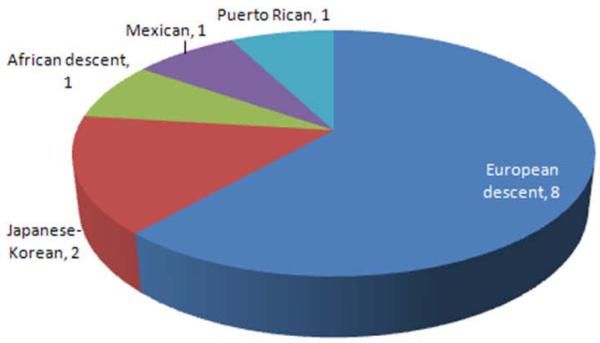
Purpose of review: Asthma and allergic diseases are common and disproportionately affect racial and ethnic minorities. Large-scale research efforts and the expense committed to multiple genomewide association studies (GWAS) have led to the identification of numerous susceptibility loci for the allergic diseases, but few successes have been reported in populations that are not of European ancestry.

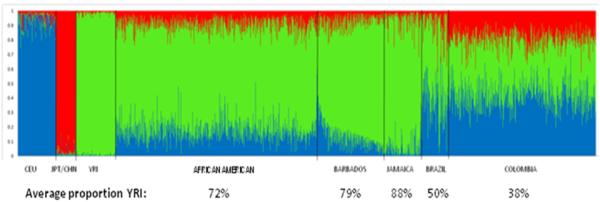
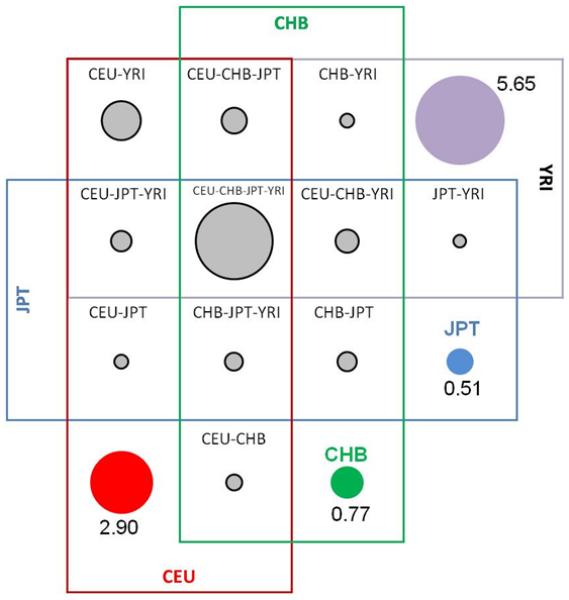
Recent findings: Of the more than two dozen GWAS for asthma and allergic disease performed to date, very few have included racial/ethnic minorities. Lessons learned from the studies conducted so far suggest that the GWAS approach must include considerations unique to the ancestral populations represented in the sample, population stratification due to admixture, and recognition that the current coverage of common variants both in the public database and on commercially available single-nucleotide polymorphism chips is inadequate to detect true genetic associations among ethnic/racial groups.

Summary: Advancements in the GWAS technology for identifying genes relevant to asthma and allergic disease among under-represented ethnic and racial minorities who suffer most will facilitate the identification and confirmation of validated genetic risk factors that are both unique to minority groups as well as confirm risk factors that are generic to the population at large.


Figures

Figure 1
Figure 1
Summary of GWAS by ethnicity of the discovery population (as of March, 2010). Panel A: All GWAS’s published in the “Catalog of Published Genome-Wide Association Studies” (http://www.genome.gov/gwastudies/) according to ethnicity/race; Panel B: Published asthma GWAS’s to date according to ethnicity/race.
Figure 1
Figure 1
Summary of GWAS by ethnicity of the discovery population (as of March, 2010). Panel A: All GWAS’s published in the “Catalog of Published Genome-Wide Association Studies” (http://www.genome.gov/gwastudies/) according to ethnicity/race; Panel B: Published asthma GWAS’s to date according to ethnicity/race.
Figure 2
Figure 2
Heterogeneity of African admixture in five populations. African Americans (N= 906), GRAAD Barbadians (N = 294), Jamaicans (N = 174), Brazilians (N= 119) and Colombians (N=668), relying on autosomal SNPs that qualify as ancestry informative SNP markers (AIMs; 416, 416, 79, 79 and 52 AIMs, respectively) with absolute differences >0.4 in allele frequencies between pairs of putative parental populations (Utah residents with ancestry from northern and western Europe, or ‘CEU’, indicated in blue; Asians collectively represented by Japanese in Tokyo, Japan, or ‘JPT’/Han Chinese in Beijing, China, or ‘CHB’, indicated in red; and Yoruba in Ibadan, Nigeria, or ‘YRI’, indicated in green). Color combinations (blue, red, green) for the five test populations reflect the degree of admixture of the three parental populations. The semi-parametric Bayesian algorithm implemented in STRUCTURE (v2.2; http://pritch.bsd.uchicago.edu/software) was used to infer both mean and individual West African, Northern European and Asian ancestry proportions in these five populations along with the Phase II HapMap groups.
Figure 3
Figure 3
A graphical representation of the overlap in 17million SNPs between four HAPMAP populations according to Phase 1 data from the 1000 Genomes Project (August, 2009). Purple SNPs are unique to YRI, red SNPs are unique to CEU, blue SNPs are unique to JPT, and green SNPs are unique to CHB. Adapted from HapMap (http://www.hapmap.org/).

References

    1. Altshuler D, Brooks LD, Chakravarti A, Collins FS, Daly MJ, Donnelly P. A haplotype map of the human genome. Nature. 2005;437:1299–320. - PMC - PubMed
    1. Joseph CL, Williams LK, Ownby DR, Saltzgaber J, Johnson CC. Applying epidemiologic concepts of primary, secondary, and tertiary prevention to the elimination of racial disparities in asthma. J Allergy Clin Immunol. 2006;117:233–40. - PMC - PubMed
    1. NIAID . Asthma: A Concern for Minority Populations. National Institutes of Health; 2001.
    1. Carter-Pokras O, Gergen P. Reported asthma among Puerto Rican, Mexican-American, and Cuban Children: 1982 through 1984. American Journal of Public Health. 1993;83(4):580–2. - PMC - PubMed
    1. Homa DM, Mannino DM, Lara M. Asthma Mortality in U.S. Hispanics of Mexican, Puerto Rican, and Cuban Heritage, 1990-1995. American Journal of Respiratory and Critical Care Medicine. 2000;161(2):504–9. - PubMed

Publication types