. 2010 May 19:2:6.
doi: 10.3389/neuro.24.006.2010. eCollection 2010.

Do different neurons age differently? Direct genome-wide analysis of aging in single identified cholinergic neurons

Affiliations

Do different neurons age differently? Direct genome-wide analysis of aging in single identified cholinergic neurons

Leonid L Moroz et al. Front Aging Neurosci. .

Abstract

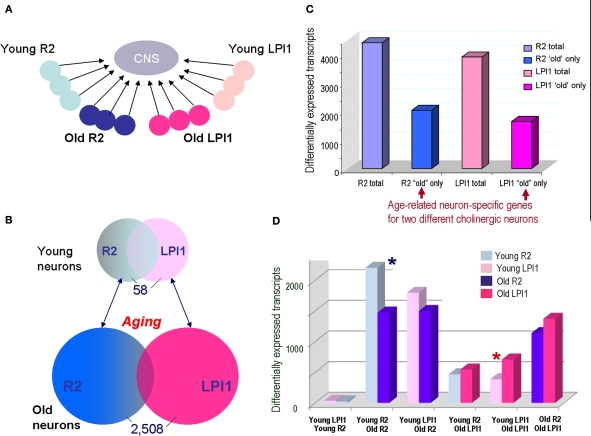
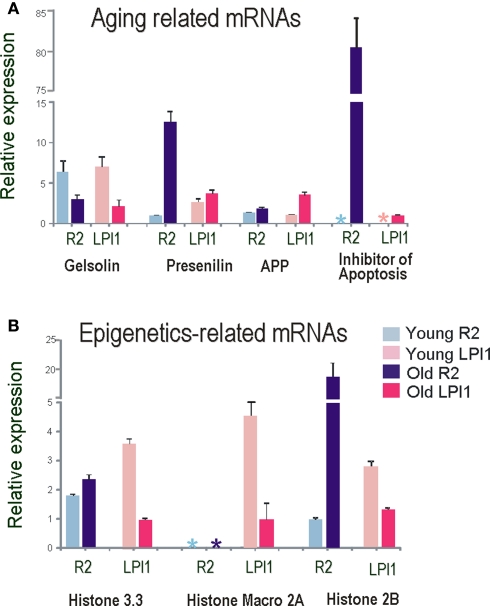
Aplysia californica is a powerful experimental system to study the entire scope of genomic and epigenomic regulation at the resolution of single functionally characterized neurons and is an emerging model in the neurobiology of aging. First, we have identified and cloned a number of evolutionarily conserved genes that are age-related, including components of apoptosis and chromatin remodeling. Second, we performed gene expression profiling of different identified cholinergic neurons between young and aged animals. Our initial analysis indicates that two cholinergic neurons (R2 and LPl1) revealed highly differential genome-wide changes following aging suggesting that on the molecular scale different neurons indeed age differently. Each of the neurons tested has a unique subset of genes differentially expressed in older animals, and the majority of differently expressed genes (including those related to apoptosis and Alzheimer's disease) are found in aging neurons of one but not another type. The performed analysis allows us to implicate (i) cell specific changes in histones, (ii) DNA methylation and (iii) regional relocation of RNAs as key processes underlying age-related changes in neuronal functions and synaptic plasticity. These mechanisms can fine-tune the dynamics of long-term chromatin remodeling, or control weakening and the loss of synaptic connections in aging. At the same time our genomic tests revealed evolutionarily conserved gene clusters associated with aging (e.g., apoptosis-, telomere- and redox-dependent processes, insulin and estrogen signaling and water channels).

Keywords: Alzheimer's disease; Aplysia; epigenetics of aging; histones; single neuron transcriptome.


Figures

Figure 1
Figure 1
The phylogenetic position of Aplysia among other model organisms. Apparently, the mollusc Aplysia has a relatively slower evolving genome compared to other model organisms such as tunicates, sea urchins, cnidarians, nematodes and insects, with remarkable similarity found between Aplysia and mammals (modified from Moroz et al., ; Moroz, ; Walters and Moroz, 2009). The lengths of different branches reflect the amino acid replacement rate for 66 KOG genes (a cluster of evolutionarily conserved genes among eukaryotes). The longer branches (e.g., for the representatives of Ecdysozoa, Tunicates and Cnidarians) imply faster evolution rates and occurrence of more derived genomes in the lineages leading to Drosophila, C. elegans, Ciona, Strongylocentrotus and Hydra. A number of homologs of neurological disease related genes found in Aplysia also show a high level of conservation (Moroz et al., 2006); similarly DNA methylation, a process known to be lost in nematodes and flies with extremely short lifecycles and particularly derived genomes, remains conserved in Aplysia.
Figure 2
Figure 2
Indentified motor neurons (LPl1 and R2) in Aplysia are among the largest somatic cells in the animal kingdom. (A) A schematic diagram of the central ganglionic nervous system of Aplysia with positions of two giant neurons (LPl1 and R2), mechanosensory pleural neurons (SN) and motor pedal neurons. LPl1 is located in the left pleural ganglion (red lines represent major axonal branches) and R2 in the abdominal ganglion (blue lines represent major axonal branches). Both the positions of these neurons and their axonal pathways are highly conserved across individuals, and these cells can be reliably identified in closely related species of the genus Aplysia (modified from Hughes and Tauc, ; Kandel, 1976) (see details in the text). (B) A photograph of the freshly dissected right abdominal semi-ganglion with the positions of R2 and R14 neurons marked (connective tissues from the ganglionic surface were removed and the natural coloration of cell somata were preserved). This R2 cell is the largest neuron ever photographed reaching 1.1 mm in diameter. When this cell was isolated (insert) and fixed in 100% ethanol it lost its pigmentation. 1.965 μg of total RNA was obtained from this neuron. These cells can also provide from 150 to 250 ng of DNA depending upon cell size.
Figure 3
Figure 3
Phylogeny of Alzheimer's disease associated proteins. (A) The phylogenetic tree for amyloid precursor protein. (B) Phylogenetic Tree for Presenilins. The position of Aplysia homologs is marked by red while arrows indicate the position and branch length for Drosophila and C. elegans homologs as more derived proteins (see text for details). (C) Predicted Aplysia amyloid-like B peptide and the conservation of a putative cleavage site. Aplysia amyloid-like B peptide shares higher identity to the human APP, BAA22264, APLP1, NP_005157.1 and APLP2, NP_001633.1, including the putative cleavage site by γ-secretase, than C. elegans, AAK68242 or Drosophila, NP_476626.2. Shark, Narke japonica BAA24230.1, zebrafish, Danio rerio AAK64495, and rat, Rattus norvegicus AAH62082.1 are included. Tree construction and sequence analysis. The phylogenetic tree was generated using default parameters and 10,000 iterations of the maximum likelihood algorithm implemented in the program TREE-PUZZLE (http://www.tree-puzzle.de). The initial multiple alignment was done using ClustalX (Thompson et al., ; Jeanmougin et al., 1998) with default parameters; all gaps were removed manually in GeneDoc (Nicholas et al., 1997) prior to tree construction. The numbers at branches represent bootstrap values for 10,000 iterations. Branch-length scale bars represent 0.1 (APP) and 0.05 (presenilins) amino acid substitutions per site. The graphical output was generated using Treeview (Page, 1996). All protein predictions were determined with Prosite (www.expasy.org/cgi-bin/scanprosite) and SMART (www.smart.embl-heidelberg.de). GB accession numbers for APP and APLP proteins are as follows: Aplysia californica, AY535409; Nematostella vectensis, XP_001637354.1; Hydra magnipapillata, XP_002154415.1; Caenorhabditis elegans, AAK68242.1; Loligo pealei, ABI84193.2; Drosophila melanogaster, NP_476626.2; Homo sapiens APP, CAA31830.1; Homo sapiens APLP1, NP_001019978.1; Homo sapiens APLP2, EAW67769.1; Danio rerio (zebrafish), NP_690842.1; Strongylocentrotus purpuratus (sea urchin), XP_790315.2; Rattus norvegicus APLP1, EDM10627.1; Rattus norvegicus APLP2, XP_001056087.1; Rattus norvegicus APP, NP_001094272.1. For the presenilin proteins: Aplysia californica, AY535407(1-1); Helix lucorum, AAG28518.1; Trichoplax adhaerens, EDV23712.1; Ephydatia fluviatilis, BAE19681.1; Monosiga brevicollis MX1, EDQ85205.1; Dictyostelium discoideum AX4, XP_635158.1; Hydra magnipapillata, XP_002168313.1; Drosophila melanogaster, NP_524184.1; Homo sapiens, BAD96893.1; Rattus norvegicus, EDL81456.1; Danio rerio (zebrafish), CAB40386.1; Strongylocentrotus purpuratus (sea urchin), XP_001178864.1.
Figure 4
Figure 4
Expression patterns of selected neuronal genes in the CNS of Aplysia californica (in situ hybridization). (A) FMRFamide expression in the pleural-pedal ganglia (dark-blue cells); Giant LPl1 neurons (as well as R2 neurons – not shown) contain FMRFamide while pleural sensory neurons (SN) do not express this transcript. (B) The expression of the amyloid precursor protein (APP) mRNA in the abdominal ganglion (dorsal view). Note a prominent expression of APP in R2 and selected motoneurons including L7. The neurosecretory neuron R14 does not show any noticeable expression of this mRNA. (C) Aplysia presenilin is selectively expressed in F-cluster neurons known as a neurosecretory center involved in control of animal bioenergetics. Serotonergic modulatory MCC neurons are shown in the anterior part of the cerebral ganglion (dorsal view) for orientation purposes; these cells are involved in feeding arousal and do not express a detectable amount of presenilin. (D) The expression of the amyloid precursor protein (APP) mRNA in the cerebral ganglion. Note a prominent expression of APP in MCC and selected groups of motoneurons including E-, A- and B-clusters (arrows). Scale bars: (A) 450 μm; (B) 500 μm; (C) 400 μm; (D) 410 μm.
Figure 5
Figure 5
Single cell digital expression profiling of selected age-related transcripts in Aplysia. (A) Sense transcripts (actual mRNAs) shown as % of their relative abundance in a transcriptome of a given identified neuron (R2 – cholinergic mucus releasing motoneuron; MCC – serotonergic modulatory neurons; SN – glutamergic mechanosensory neurons; L7 – one of the major motoneurons of the siphon-/gill- withdrawal reflex). (B) Relative abundance of corresponding antisense transcripts. It is shown as a percentage of antisense transcripts to the total number of both sense and antisense transcripts in a transcriptome of a given neuron generated by 454 pyrosequencing (see details in the text). Abbreviations for Aplysia gene homologs: TAU is the tau protein (GB# GU255944); APP – the amyloid precursor protein (GB# AY535409); Major Vault – the major vault protein (GB# GU255949); ApoE receptor – the appoprotein E (GB# GU255953); Insulin DE – putative insulin degrading enzyme (GB# GU255946); Huntingtin (GB# GU255950). See also Table 1 for information about individual genes.
Figure 6
Figure 6
A comparison of gene expression profiling between heterogenous ganglionic and single-cell samples from young and old animals. (A) Identification of age-related transcripts using the abdominal ganglion (∼1000 cells). (B) Identification of age-related transcripts in the identified cholinergic motoneuron R2. Both scatter plots show differential expression between the two samples of interest (log base 10). Differentially expressed transcripts from old animals are shown as red dots, and from young animals as green dots. Common transcripts (i.e., transcripts with similar expression levels in two samples) are removed. The scatter plot for a representative array in (A), when two abdominal ganglia were compared, indicates a smaller scale of detected differential expression vs. single-cell gene expression profiling (B) under the same hybridization conditions. The single neuron experiment also shows much higher diversity of differentially expressed transcripts (e.g., transcripts affected by aging). The direct comparison array experiment (B) identified 3,855 differentially expressed genes in young and old R2 neurons (or 9% from the total number of tested transcripts: 2,291 transcripts were found to be differentially expressed in young R2 and 1,566 transcripts in old R2 at >2-fold change and a 5% FDR). These results also illustrate the importance and need for single cell analysis that takes into consideration the observed heterogeneity of even small neuronal samples (see text for details). All direct comparison arrays were performed with three biological replicates from different ganglia or single cells isolated from different animals. Differentially expressed transcripts for the single cell R2 experiments can be found at GEO Series accession number GSE18783 and Table S2 in Supplementary Material.
Figure 7
Figure 7
Comparison of age-related changes in gene expression between two identified cholinergic neurons LPl1 and R2. (A) The schematic representation of the reference design microarray experiments to compare two different cell types R2 and LPL1 during the aging process. In these microarray tests, individual neurons were compared to the same reference CNS sample [see Materials and Methods, and legends for (C,D) below]. The individual circles represent single neurons (LPl1 – red tones; and R2 – blue tones) from young or old animals. (B) We found that only 58 neuronal transcripts (∼0.1%) are differentially expressed when LPl1 and R2 neurons are compared from young animals. In contrast, when the same cells were directly compared from old animals, we identified 2508 differentially expressed transcripts (∼4.5%). This suggests that identified cholinergic motoneurons are more similar to each other in younger animals than the same neuronal types in older animals. (C) The scope of detected age related transcripts in indentified neurons from a reference design experiment as in (A). This histogram shows the total number of transcripts differentially affected by aging in both LPl1 (3930) and R2 (4440), as compared to a reference CNS sample, and a fraction of transcripts whose differential expressions were only found in one but not another neuronal type. For example, 2057 transcripts were found to be differentially expressed only in R2 neurons without significant changes for the same transcripts in LPl1; correspondingly, we identify 1660 transcripts that changed their expression in aged LPl1 neurons but not in R2. (D) Cross cell comparisons of uniquely expressed transcripts among the four neuronal samples (young R2, old R2, young LPl1 and old LPl1) from a reference design. The number of the differentially expressed transcripts was plotted for all the combinations of cell–cell comparisons: (i) Young LPl1–Young R2; (ii) Young R2–Old R2; (iii) Young LPl1–Old R2; (iv) Young R2–Old LPl1; (v) Young LPl1–Old LPl1; and (vi) Old R2–Old LPl1. The most remarkable of these comparisons is a confirmation of the data from (B): the Young LPl1_Young R2 with a total of 58 transcripts differentially expressed. However, Old R2–Old LPl1 has >2500 transcripts differentially expressed suggesting neuronal transcriptomes change dramatically during aging. Second, it appears that the scope of age related changes is much more prominent in R2 neurons than in LPl1 neurons (compare blue asterisks for R2 and red asterisks for LPl1). The data summarized in (C,D) are based on the MANOVA analysis for both the single cell and aging effects within the reference type experiments as illustrated in (A). A >2-fold change and a ≤5% FDR differentially expressed transcripts for all the single cells were determined from combined AAA and DAA array data, see GEO series accession number GSE18783 and Tables S3 and S4 in Supplementary Material. Combined, these results suggest that the aging process in these neurons is not identical; differential subsets of genes uniquely and cells specifically change their expression as these neurons undergo normal aging. Examples of specific transcripts are listed in Table 2.
Figure 8
Figure 8
Single cell Q-RT-PCR analysis of differentially expressed transcripts as a function of aging in identified neurons. Several transcripts differentially expressed on the microarrays were validated by Quantitative RT PCR. All data were normalized to 18S RNA and all tests were performed in quadruplicate and statistically analyzed (see text and Materials and Methods for details). (A) Relative expression of Gelsolin and Alzheimer's disease related transcripts in identified cholinergic neurons R2 (blue bars) and LPl1 (red bars). Asterisks indicate no detectable levels of expression in a given cell (R2 and LPl1) for inhibitors of apoptosis in young animals. These results were validated by reported values obtained from microarray tests. (B) Relative expression of different histone variants in identified cholinergic neurons R2 (blue bars) and LPl1 (red bars). Asterisks indicate no detectable level of expression in macro 2A histone in R2 neurons isolated from both young and old animals.
Figure 9
Figure 9
Waddington type landscape superposed with the distinct epigenetic trajectories for different neuronal types as a function of aging. The landscape diagram is modified from Waddington, C. H., (Principles of Embryology, op. cit., p. 412). Following Waddington's visual schematics, the ball represents a neuronal fate. The valleys are the different fates a given neuron might roll into. At the beginning of its journey, development is plastic, and a cell can have many fates. However, as development and aging proceeds, certain molecular events occur randomly and this can lead to different underlying molecular phenotypes and decisions that cannot be reversed.

References

    1. Ambron R. T., Rayport S. G., Babiarz J. (1988). Giant Aplysia neuron R2 has distal dendrites: evidence for protein sorting and a second spike initiation site. J. Neurosci. 8, 722–731 - PMC - PubMed
    1. Antonov I., Ha T., Antonova I., Moroz L. L., Hawkins R. D. (2007). Role of nitric oxide in classical conditioning of siphon withdrawal in Aplysia. J. Neurosci. 27, 10993–1100210.1523/JNEUROSCI.2357-07.2007 - DOI - PMC - PubMed
    1. Bailey C. H., Kandel E. R. (2008). Synaptic remodeling, synaptic growth and the storage of long-term memory in Aplysia. Prog. Brain Res. 169, 179–19810.1016/S0079-6123(07)00010-6 - DOI - PubMed
    1. Bodnarova M., Martasek P., Moroz L. L. (2005). Calcium/calmodulin-dependent nitric oxide synthase activity in the CNS of Aplysia californica: biochemical characterization and link to cGMP pathways. J. Inorg. Biochem. 99, 922–92810.1016/j.jinorgbio.2005.01.012 - DOI - PubMed
    1. Brosnan C. A., Voinnet O. (2009). The long and the short of noncoding RNAs. Curr. Opin. Cell Biol. 21, 416–42510.1016/j.ceb.2009.04.001 - DOI - PubMed