

Absence seizures: individual patterns revealed by EEG-fMRI
- PMID: 20726875
- PMCID: PMC3769289
- DOI: 10.1111/j.1528-1167.2010.02698.x
Absence seizures: individual patterns revealed by EEG-fMRI
Abstract
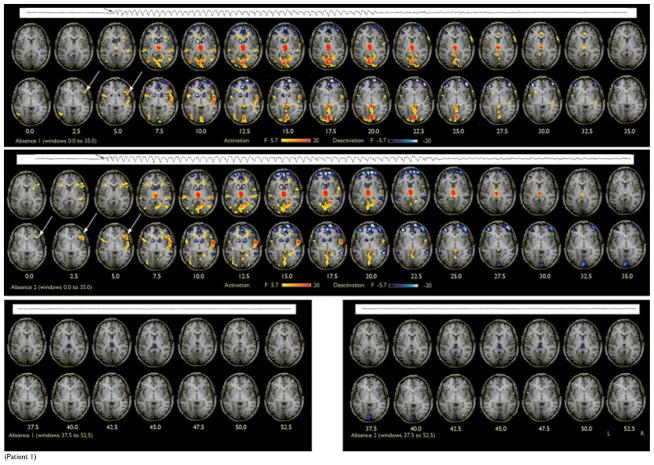
Purpose: Absences are characterized by an abrupt onset and end of generalized 3-4 Hz spike and wave discharges (GSWs), accompanied by unresponsiveness. Although previous electroencephalography-functional magnetic resonance imaging (EEG-fMRI) studies showed that thalamus, default mode areas, and caudate nuclei are involved in absence seizures, the contribution of these regions throughout the ictal evolution of absences remains unclear. Furthermore, animal models provide evidence that absences are initiated by a cortical focus with a secondary involvement of the thalamus. The aim of this study was to investigate dynamic changes during absences.
Methods: Seventeen absences from nine patients with absence epilepsy and classical pattern of 3-4 Hz GSWs during EEG-fMRI recording were included in the study. The absences were studied in a sliding window analysis, providing a temporal sequence of blood oxygen-level dependent (BOLD) response maps.
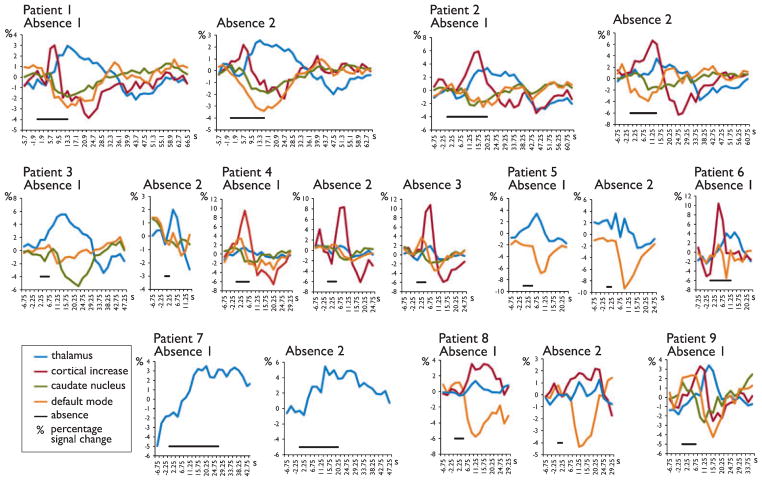
Results: Thalamic activation was found in 16 absences (94%), deactivation in default mode areas in 15 (88%), deactivation of the caudate nuclei in 10 (59%), and cortical activation in patient-specific areas in 10 (59%) of the absences. Cortical activations and deactivations in default mode areas and caudate nucleus occurred significantly earlier than thalamic responses.
Discussion: Like a fingerprint, patient-specific BOLD signal changes were remarkably consistent in space and time across different absences of one patient but were quite different from patient to patient, despite having similar EEG pattern and clinical semiology. Early frontal activations could support the cortical focus theory, but with an addition: This early activation is patient specific.
Wiley Periodicals, Inc. © 2010 International League Against Epilepsy.
Conflict of interest statement
None of the authors has any conflict of interest to disclose. We confirm that we have read the Journal’s position on issues involved in ethical publication and affirm that this report is consistent with those guidelines.
Figures


Similar articles
-
Linking generalized spike-and-wave discharges and resting state brain activity by using EEG/fMRI in a patient with absence seizures.Epilepsia. 2006 Feb;47(2):444-8. doi: 10.1111/j.1528-1167.2006.00443.x. Epilepsia. 2006. PMID: 16499775
-
EEG-fMRI study on the interictal and ictal generalized spike-wave discharges in patients with childhood absence epilepsy.Epilepsy Res. 2009 Dec;87(2-3):160-8. doi: 10.1016/j.eplepsyres.2009.08.018. Epilepsy Res. 2009. PMID: 19836209
-
Cortical and subcortical contributions to absence seizure onset examined with EEG/fMRI.Epilepsy Behav. 2010 Aug;18(4):404-13. doi: 10.1016/j.yebeh.2010.05.009. Epub 2010 Jun 26. Epilepsy Behav. 2010. PMID: 20580319 Free PMC article.
-
Generalized nonmotor (absence) seizures-What do absence, generalized, and nonmotor mean?Epilepsia. 2018 Mar;59(3):523-529. doi: 10.1111/epi.13996. Epub 2018 Jan 11. Epilepsia. 2018. PMID: 29327337 Review.
-
Electroencephalography-functional magnetic resonance imaging of epileptiform discharges: Noninvasive investigation of the whole brain.Epilepsia. 2022 Nov;63(11):2725-2744. doi: 10.1111/epi.17364. Epub 2022 Jul 27. Epilepsia. 2022. PMID: 35822919 Review.
Cited by
-
A computational study of stimulus driven epileptic seizure abatement.PLoS One. 2014 Dec 22;9(12):e114316. doi: 10.1371/journal.pone.0114316. eCollection 2014. PLoS One. 2014. PMID: 25531883 Free PMC article.
-
Understanding of Consciousness in Absence Seizures: A Literature Review.Neuropsychiatr Dis Treat. 2024 Jun 24;20:1345-1353. doi: 10.2147/NDT.S391052. eCollection 2024. Neuropsychiatr Dis Treat. 2024. PMID: 38947367 Free PMC article. Review.
-
Spontaneous epileptiform activity in a rat model of bilateral subcortical band heterotopia.Epilepsia. 2019 Feb;60(2):337-348. doi: 10.1111/epi.14633. Epub 2018 Dec 30. Epilepsia. 2019. PMID: 30597542 Free PMC article.
-
EEG Oscillatory Networks in Peri-Ictal Period of Absence Epilepsy.Front Neurol. 2022 Apr 25;13:825225. doi: 10.3389/fneur.2022.825225. eCollection 2022. Front Neurol. 2022. PMID: 35547382 Free PMC article.
-
From Physiology to Pathology of Cortico-Thalamo-Cortical Oscillations: Astroglia as a Target for Further Research.Front Neurol. 2021 Jun 9;12:661408. doi: 10.3389/fneur.2021.661408. eCollection 2021. Front Neurol. 2021. PMID: 34177766 Free PMC article. Review.
References
-
- Aarabi A, Wallois F, Grebe R. Does spatiotemporal synchronization of EEG change prior to absence seizures? Brain Res. 2008;1188:207–221. - PubMed
-
- Aghakhani Y, Bagshaw AP, Benar CG, Hawco C, Andermann F, Dubeau F, Gotman J. fMRI activation during spike and wave discharges in idiopathic generalized epilepsy. Brain. 2004;127:1127–1144. - PubMed
-
- Allen PJ, Josephs O, Turner R. A method for removing imaging artifact from continuous EEG recorded during functional MRI. Neuroimage. 2000;12:230–239. - PubMed
-
- Amor F, Baillet S, Navarro V, Adam C, Martinerie J, Le Van Quyen M. Cortical local and long-range synchronization interplay in human absence seizure initiation. Neuroimage. 2009;45:950–962. - PubMed
-
- Bénar C, Aghakhani Y, Wang Y, Izenberg A, Al-Asmi A, Dubeau F, Gotman J. Quality of EEG in simultaneous EEG-fMRI for epilepsy. Clin Neurophysiol. 2003;114:569–580. - PubMed
Publication types
MeSH terms
Substances
Grants and funding
LinkOut - more resources
Full Text Sources
Medical
Molecular Biology Databases
