. 2010 Sep;32(5):847-58.
doi: 10.1111/j.1460-9568.2010.07358.x. Epub 2010 Aug 19.

Cortical cholinergic abnormalities contribute to the amnesic state induced by pyrithiamine-induced thiamine deficiency in the rat

Affiliations

Cortical cholinergic abnormalities contribute to the amnesic state induced by pyrithiamine-induced thiamine deficiency in the rat

Steven Anzalone et al. Eur J Neurosci. 2010 Sep.

Abstract

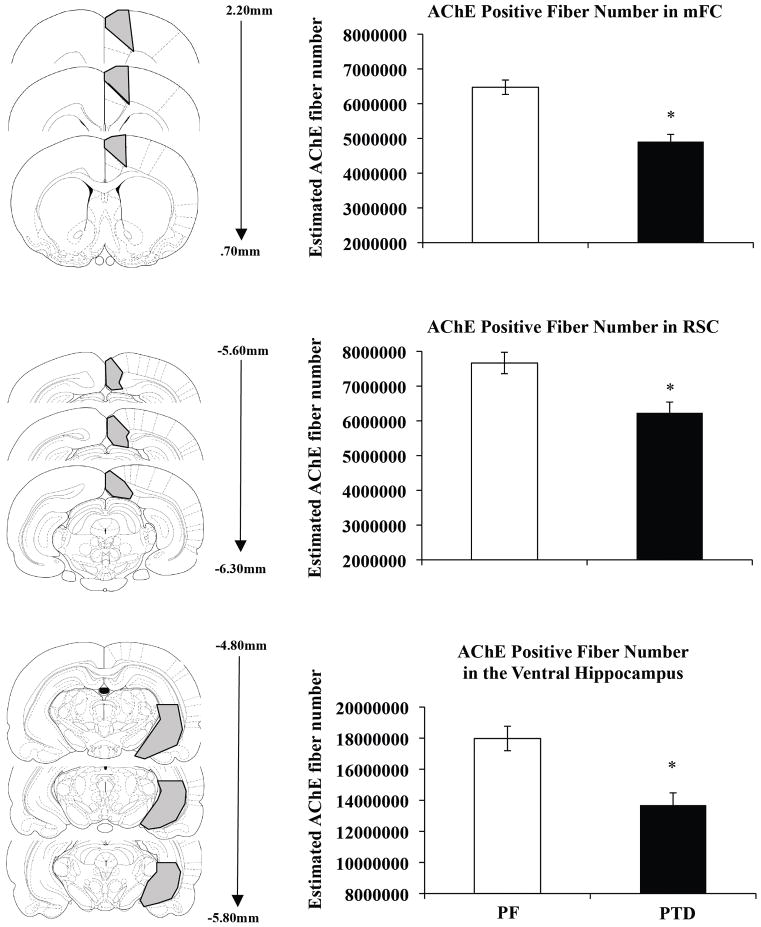
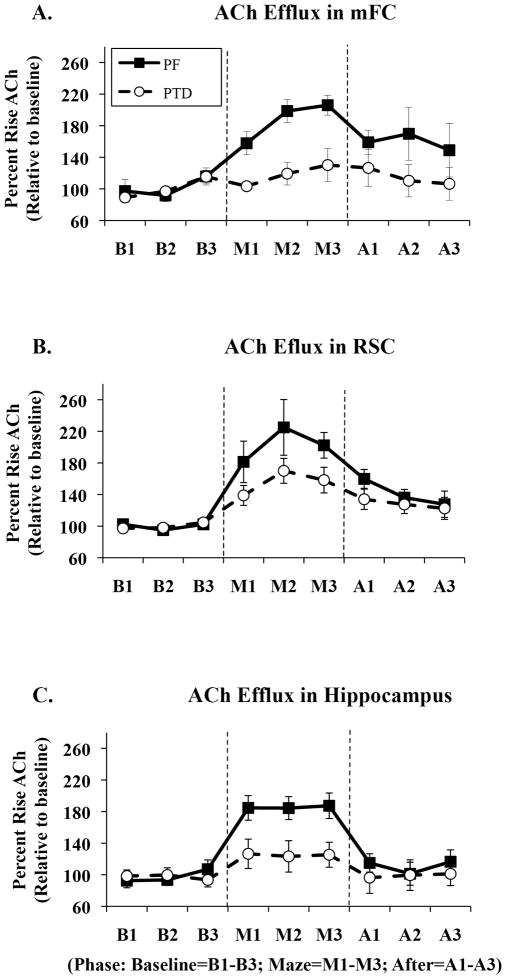
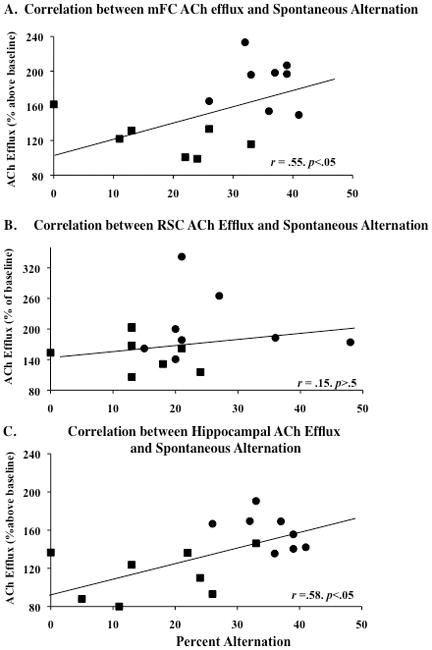
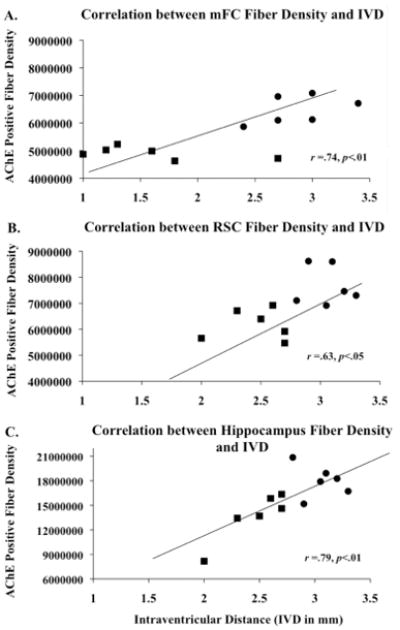
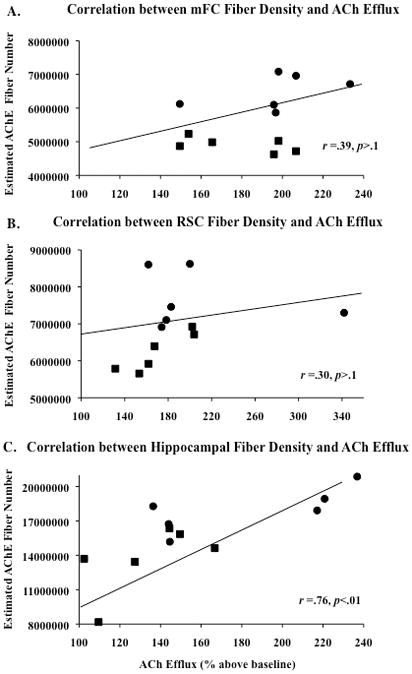
Although the key neuropathology associated with diencephalic amnesia is lesions to the thalamus and/or mammillary bodies, functional deactivation of the hippocampus and associated cortical regions also appear to contribute to the memory dysfunction. For example, there is loss of forebrain cholinergic neurons and alterations in stimulated acetylcholine (ACh) levels in the hippocampus and cortex in animal models of diencephalic amnesia associated with thiamine deficiency. In the present study, the pyrithiamine-induced thiamine deficiency rat model was used to assess the functional relationships between thalamic pathology, behavioral impairment, ACh efflux and cholinergic innervation of the hippocampus and cortex. In pyrithiamine-induced thiamine deficiency-treated rats, ACh efflux during behavioral testing was blunted to differing degrees in the hippocampus, medial frontal cortex and retrosplenial cortex. In addition, significant reductions in cholinergic fiber densities were observed in each of these regions. However, only hippocampal cholinergic fiber density correlated significantly with ACh efflux in the same region, suggesting that the reduction in cortical ACh efflux in cases of diencephalic amnesia cannot be fully explained by a loss of cholinergic fiber innervation. This notion supports the emerging theory that the functional consequences of the distal effects of lesions go beyond simple deafferentation. Specifically, some frontal cortical regions exhibit hypersensitivity to deafferentation that is only detected during behavioral and/or physiological demand.


Figures

Figure 1
Figure 1
Methods for stereological quantification of acetylcholinesterase-labeled (AChE) fibers. X, Y (panel A) and Z dimensions (panel B) for sampling and counting frames used for quantification of AChE fibers. Representative photomicrograph of AChE-labeled fibers (panel C; 100x magnification) with superimposed counting frame.
Figure 2
Figure 2
Neuronal specific nuclear protein (NeuN) stained slides comparing the thalamus and mammillary bodies of PF and PTD rats. The top row (A and B) show the state of anterior thalamic nuclei in both PF and PTD animals including the anteroventral ventrolateral (AVVL), anteroventral dorsal medial (AVDM) and anterodorsal nucleus (AD). The middle row of images (C and D) display representative images of midline and intralaminar thalamic structures including the following nuclei and fiber tracts: internal medullary laminae (IML), paracentral nucleus (PC), central medial nucleus (CM), interanteromedial nucleus (IAM), intermediodorsal nucleus (IMD), paraventricular nucleus (PV), central mediodorsal nucleus (MDC), medial and lateral mediodorsal nucleus (MDM/MDL). The bottom row (E and F) display representative samples of the mammillary bodies of both groups including the mammillothalamic tract (MT), mammillary peduncle (mp) medial mammillary nucleus (MM) posterior medial mammillary nucleus (MP), lateral medial mammillary nucleus (ML) lateral mammillary nucleus (LM) and the supramammillary nucleus (SuM).
Figure 3
Figure 3
Histological verification of cannulae placement. Representative photomicrographs of Nissl-stained sections of cannula tracts in medial frontal cortex (mFC; A), retrospenial cortex (RSC, B), and hippocampus (C). Schematic representation of cannula placement of all animals implanted in the mFC (D), RSC (E) and hippocampus (F).
Figure 4
Figure 4
Reduced estimated number of acetylcholinesterase labeled (AChE) fibers in PTD rats. Schematic representation of regions sampled in the mFC, RSC, and hippocampus (left panels in A–C, respectively) and approximate Interaural distances of sampled sections (middle panels in A–C, respectively). Comparison of estimated total number of AChE fibers in mFC, RSC, and hippocampus (right panels in A–C, respectively). Asterisks indicate significant difference (p<0.05).
Figure 5
Figure 5
Reduced spontaneous alternation (Mean ± SEM) but not activity levels in PTD rats. Percent alternation scores (panel A) and number of arms entered (panel B) during the 18 min testing period in PF and PTD rats. Asterisks indicate significant difference (p<0.01).
Figure 6
Figure 6
Comparisons of acetylcholine (ACh) efflux profiles (Mean rise above baseline ± SEM) of the medial frontal cortex (mFC, A), retrospenial cortex (RSC, B) and hippocampus (C) of PF (circles) and PTD (squares) animals during baseline (B1, B2, B3), maze (M1, M2, M3) and post-baseline (A1, A2, A3) phases. Acetylcholine efflux significantly increased by 110% over baseline in the mFC and 80% in the hippocampus of PF animals, while PTD animals displayed no significant ACh rise in the mFC and a blunted ACh efflux of only 20% above baseline in the hippocampus (p’s<.01). ACh efflux in the RSC was only mildly impaired as PF rats displayed a 100% increase above basal ACh levels during maze traversal and PTD animals displayed a 60% increase relative to baseline (p=.056). The three graphs also illustrate the differences in ACh profiles between the hippocampus and cortex of intact PF animals.
Figure 7
Figure 7
Positive correlations (p’s<.05) between spontaneous alternation performance and acetylcholine (ACh) efflux in the mFC and hippocampus but not RSC. Relationship between spontaneous alternation performance and ACh efflux in the mFC (A), RSC (B), and hippocampus (C) observed in PF (circles) and PTD (squares) groups. The trend lines on each graph show the combined regression analyses for the PTD (squares) and PF (circles) groups.
Figure 8
Figure 8
Positive correlations (p’s<.05) between thalamic mass/intraventricular distance (IVD) and acetylcholinesterase-labeled (AChE) fibers in the medial frontal cortex (mFC), retrospenial cortex (RSC), and hippocampus. Relationship between IVD and ACh fibers in the mFC (A), RSC (B), and hippocampus (C) observed in PF (circles) and PTD (squares) groups.
Figure 9
Figure 9
Correlations between estimated acetylcholinesterase-labeled (AChE) fiber number and ACh efflux in the he medial frontal cortex (mFC, A), retrospenial cortex (RSC, B) were not significant. However, there was a positive correlation between AChE positive fiber numbers and acetylcholine (ACh) efflux in the hippocampus (C: p<.01). Trend lines of each graph display the combined regression analyses for the PTD (squares) and PF (circles) groups.

References

    1. Acquas E, Wilson C, Fibiger HC. Conditioned and unconditioned stimuli increase frontal cortical and hippocampal acetylcholine release: Effects of novelty, habituation and fear. Learn Mem. 1996;16:21–27. - PMC - PubMed
    1. Aggleton JP. Understanding anterograde amnesia: Disconnections and lesions. Q J Exp Psychol. 2008;61:1441–1471. - PubMed
    1. Amaral DG, Kurz J. An analyses of the origins of the cholinergic and non-cholinergic septal projections to the hippocampal formation of the rat. J Comp Neurol. 1985;240:37–59. - PubMed
    1. Anzalone SA, Roland J, Vogt B, Savage LM. Acetylcholine efflux from retrosplenial areas and hippocampal sectors during maze exploration. Behav Brain Res. 2009;201:272–278. - PMC - PubMed
    1. Big IV, Woolf NJ, Butcher LL. Cholinergic projections from the basal forebrain to frontal, parietal, temporal, occipital, and cingulate corticies: A combined fluorescent tracer and acetylcholinesterase analysis. Brain Res. 1982;8:727–763. - PubMed

Publication types

MeSH terms