. 2010 Oct;32(7):1223-38.
doi: 10.1111/j.1460-9568.2010.07376.x. Epub 2010 Aug 18.

β-Secretase-1 elevation in aged monkey and Alzheimer's disease human cerebral cortex occurs around the vasculature in partnership with multisystem axon terminal pathogenesis and β-amyloid accumulation

Affiliations

β-Secretase-1 elevation in aged monkey and Alzheimer's disease human cerebral cortex occurs around the vasculature in partnership with multisystem axon terminal pathogenesis and β-amyloid accumulation

Yan Cai et al. Eur J Neurosci. 2010 Oct.

Abstract

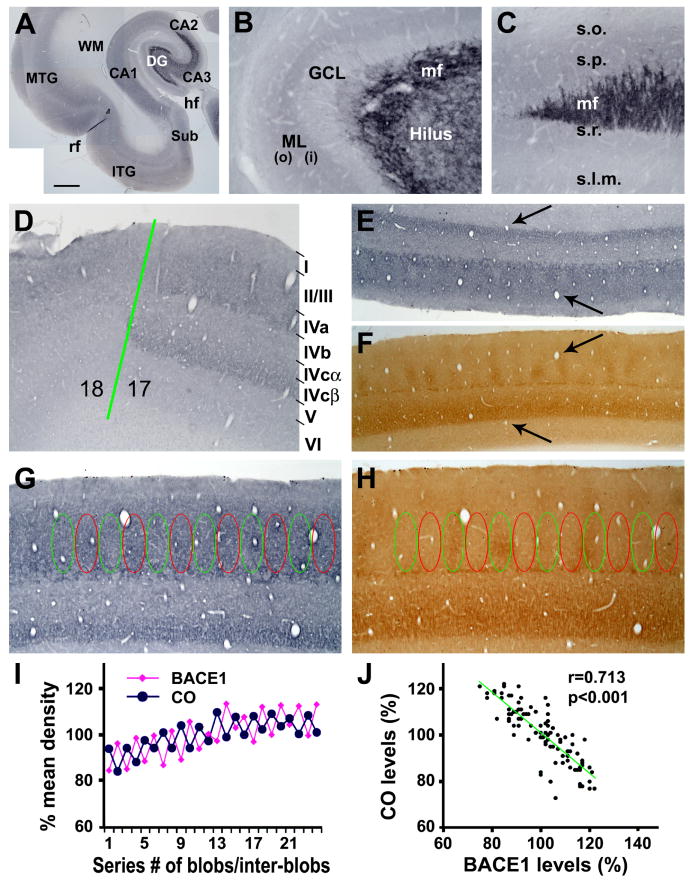
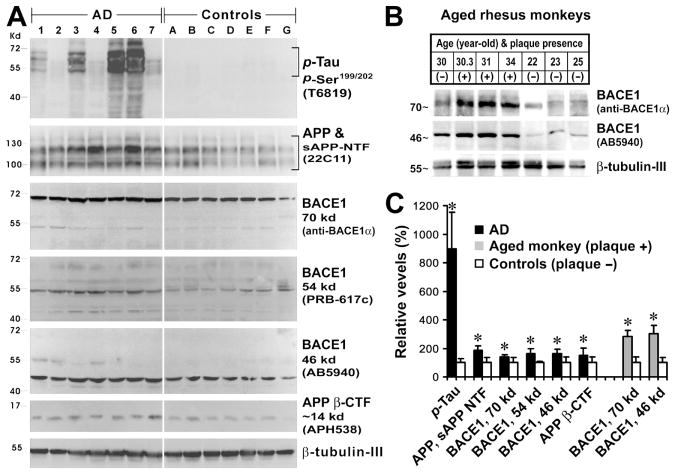
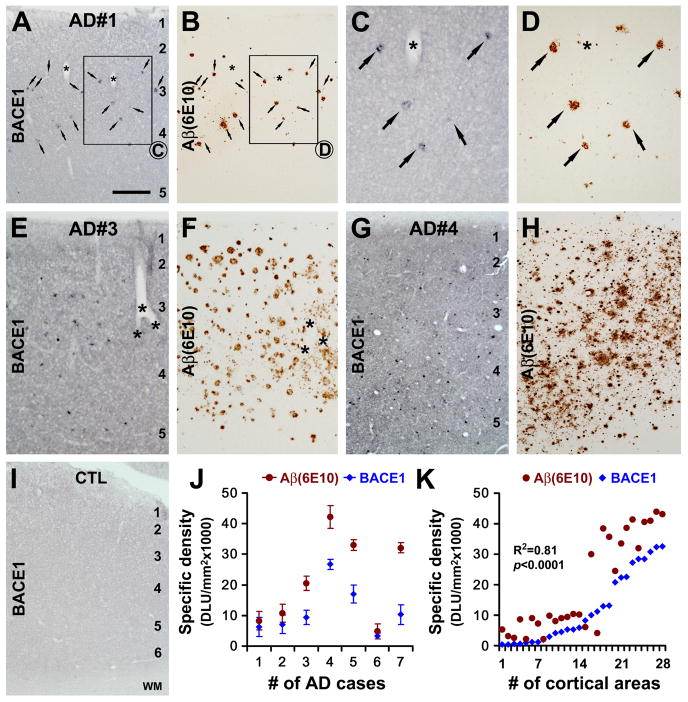
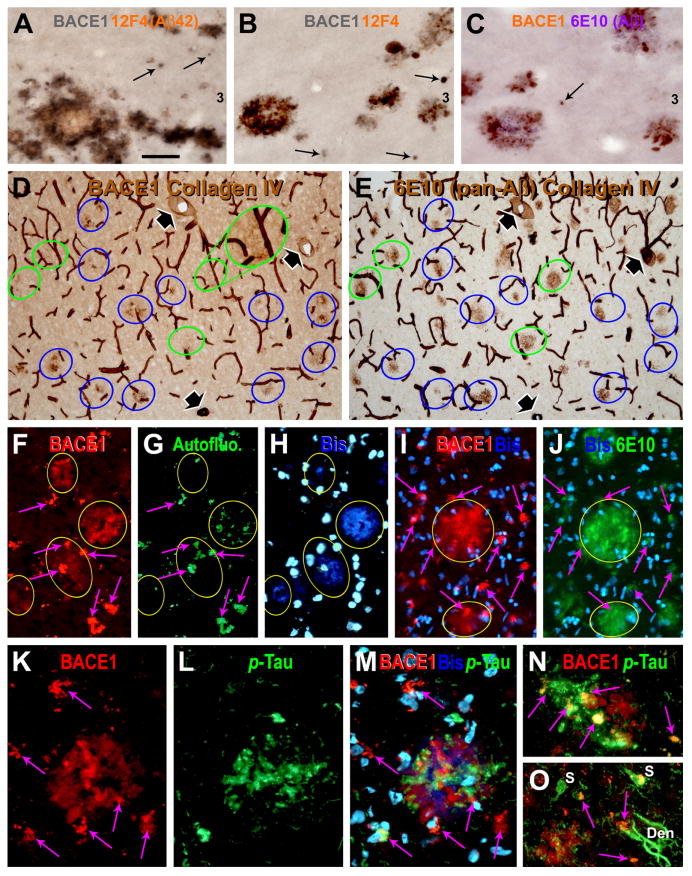
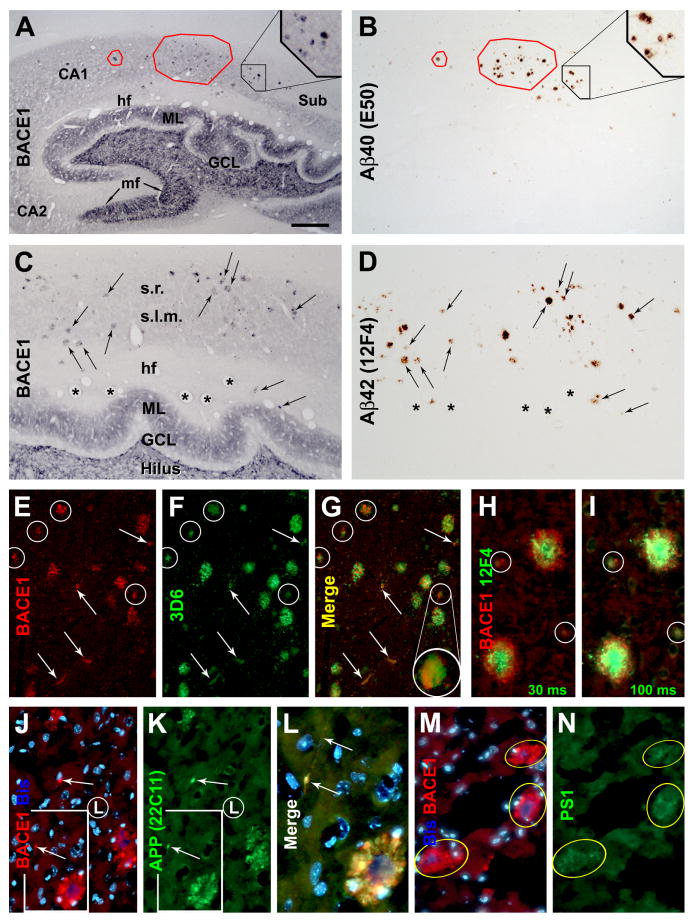
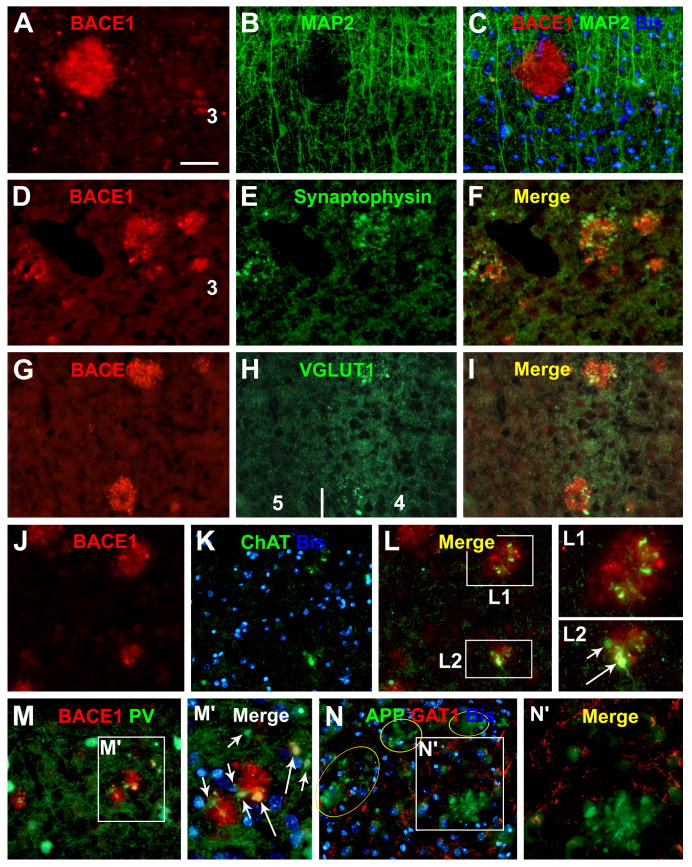
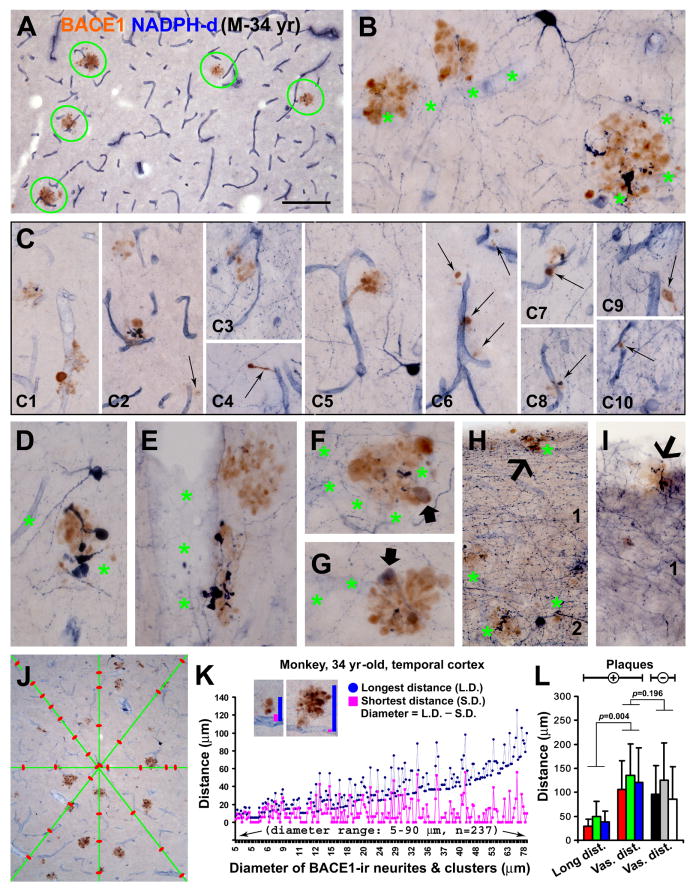
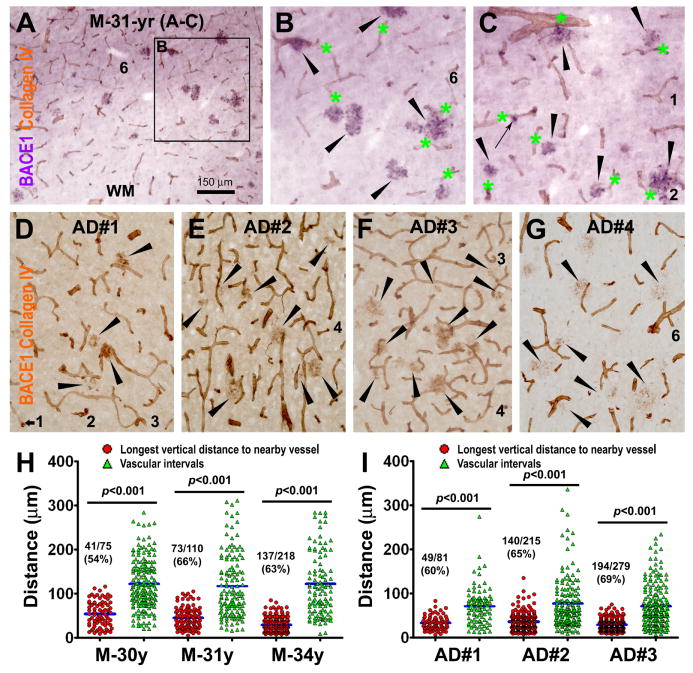
Alzheimer's disease (AD) is the most common dementia-causing disorder in the elderly; it may be related to multiple risk factors, and is characterized pathologically by cerebral hypometabolism, paravascular β-amyloid peptide (Aβ) plaques, neuritic dystrophy, and intra-neuronal aggregation of phosphorylated tau. To explore potential pathogenic links among some of these lesions, we examined β-secretase-1 (BACE1) alterations relative to Aβ deposition, neuritic pathology and vascular organization in aged monkey and AD human cerebral cortex. Western blot analyses detected increased levels of BACE1 protein and β-site-cleavage amyloid precursor protein C-terminal fragments in plaque-bearing human and monkey cortex relative to controls. In immunohistochemistry, locally elevated BACE1 immunoreactivity (IR) occurred in AD but not in control human cortex, with a trend for increased overall density among cases with greater plaque pathology. In double-labeling preparations, BACE1 IR colocalized with immunolabeling for Aβ but not for phosphorylated tau. In perfusion-fixed monkey cortex, locally increased BACE1 IR co-existed with intra-axonal and extracellular Aβ IR among virtually all neuritic plaques, ranging from primitive to typical cored forms. This BACE1 labeling localized to swollen/sprouting axon terminals that might co-express one or another neuronal phenotype markers (GABAergic, glutamatergic, cholinergic, or catecholaminergic). Importantly, these BACE1-labeled dystrophic axons resided near to or in direct contact with blood vessels. These findings suggest that plaque formation in AD or normal aged primates relates to a multisystem axonal pathogenesis that occurs in partnership with a potential vascular or metabolic deficit. The data provide a mechanistic explanation for why senile plaques are present preferentially near the cerebral vasculature.


Figures

FIG. 1
FIG. 1
BACE1 immunoreactivity (IR) in normal monkey hippocampal formation (A-C) and visual cortex (images are from the 22 year-old animal). BACE1 IR occurs generally in the neuropil across the temporal lobe regions including the subiculum (Sub), inferior and medial temporal gyri (ITG, MTG) and hippocampus CA1 and CA2 sectors (A). BACE1 IR in the dentate gyrus (DG) distinctly delineates the mossy fiber (mf) pathway in the hilus extending along CA3 and ending at the CA3/CA2 border (B, C). The granule cell layer (GCL) shows faint labeling except for some mossy fibers from the hilus. The neuropil reactivity in the molecular layer (ML) is noticeable heavier in the inner (i) than the outer (o) portion of this layer (B). The laminar distribution pattern of BACE1 IR changes abruptly at the border between areas 17 and 18. In area 17 (striate cortex), BACE1 neuropil reactivity occurs as two bands over laminae II-IVa and IVcβ (D), a laminar pattern similar to that of cytochrome c oxidase (CO) reactivity (E, F). BACE1 IR in lamina III/IVa appears as regularly-spaced alternating zones/compartments with low and high intensities, which are complementary to CO reactivities in the blob and interblob zones (E-H). Optic densities (o.d.) in these lamina III/IVa compartments are measured first in CO sections, and the measuring templates are copied and then aligned over adjacent BACE1 sections coordinately (G, H). Specific BACE1/CO densities are calculated by using the BACE1/CO densities measured over the underlying white matter as cut-off thresholds. The resulting specific BACE1/CO densities in individual blob and interblob zones are normalized to the corresponding means of all zones, yielding the relative densities or levels (% of mean density) in individual zones. (I) Plots the relative densities of BACE1 and CO reactivities among 24 neighboring compartments from a representative section. (J) Shows a negative correlation (r=0.713, p<0.001) between BACE1 and CO levels among ∼100 compartments measured in 2 sets of sections from each of the two youngest monkeys (22 and 23 year-old). Lamination of the striate cortex is marked on the right of (D). Arrows in (E, F) point to blood vessels. hf: hippocampal fissure; rf: rhinal fissure; s.o.: stratum oriens; s.p.: stratum pyramidale; s.r.: stratum radiatum; s.l.m.: stratum lacunosum-moleculare. Scale bar in (A) = 2 mm, equal to 100 μm for (B-D, G, H) and 200 μm for (E, F).
FIG. 2
FIG. 2
Immunoblotting of cortical samples from aged humans (n=14) (A) and monkeys (n=7) (B) confirming elevations of some Alzheimer's disease (AD) related proteins in diseased brains relative to controls (free of amyloid or tangle pathology). All data are normalized to the corresponding means (e.g., 100%) of the control groups. Levels of phosphorylated tau (p-Tau), full-length amyloid precursor protein (APP) and its N-terminal fragments (sAPP NTF), BACE1 proteins migrated at 70, 54 and 46 kd, and β-site cleavage APP C-terminal fragment migrated at ∼14 kd are significantly higher in AD relative to control samples (C). Levels of the 70 and 46 kd BACE1 proteins are elevated in aged monkey cortices with cerebral plaques relative to plaque-free cases (C). *: p<0.05.
FIG. 3
FIG. 3
Comparative anatomical and densitometric analyses of BACE1 and Aβ (6E10) immunoreactivity (IR) in postmortem human cortex. (A-H) show representative images of BACE1 and Aβ IR in consecutive temporal cortical sections from AD cases with varying plaque pathology. BACE1-labeled profiles appear to match site-specifically with plaques in the cortex with relatively mild plaque load (A-D). In AD cortex with heavier amyloid loads, BACE labeled profiles appear to be less numerous relative to plaques (E-H). In control cortical sections, BACE1 (I) and Aβ (not shown) IR appears as weak and diffuse background staining. Therefore, the mean optic density of BACE1 or Aβ IR obtained from batch-processed control sections is used as the cut-off threshold to define the specific densities in the AD cortical sections (I, K). Panel (J) plots the specific densities (mean ± S.D., from 4 microscopic fields per brain) of BACE1/Aβ IR measured in the temporal cortex among the 7 AD cases. Panel (K) plots the same set of data by analyzed cortical fields, which yields an overall positive correlation (R2=0.81, p<0.0001) between specific densities of BACE1 and Aβ IR in AD cortex regardless of individual cases. Asterisks in (A-F) indicate blood vessels used as landmarks to help identify profiles between consecutive sections. Scale bar=500 μm in (A) applying to (B, E-H, L), equal to 250 μm for (C, D), and 50 μm for (I).
FIG. 4
FIG. 4
Double labeling for BACE1, Aβ and phospho-tau (p-Tau) in AD cortex. Panels (A-C) show examples of BACE1/Aβ colocalization in dual chromogen labeling. BACE1 IR may occur as small isolated spherical elements, which are not surrounded by extracellular Aβ deposits (pointed by arrows). In adjacent sections with the blood vessels (with 3 large ones indicated by fat arrows) co-stained by collagen-IV (D, E), BACE1 IR matches site-specifically with Aβ IR among most plaques profiles (green and blue cycles). However, some prominent Aβ plaques are associated less distinct BACE1 IR appearing as numerous dot-like or a few small process-like elements (compare profiles marked with green cycles between D and E, also see Fig. 8G). In double immunofluorescence, specific BACE1 labeling (yellow arrows) is seen through the red fluorescent filter only, whereas the lipofuscin autofluorescence (purple arrows) is strong but evident through both the red and green fluorescent filters (F, G). Of note, the amyloid core (yellow arrows) is visible through the blue fluorescent filter due to amyloid autofluorescence (H), especially by using a relatively long exposure time [(the bisbenzimide (Bis) nuclear stain is very bright in this case)]. Panels (I and J) show example of BACE1/Aβ colocalization in AD cortex that is distinguishable from non-specific autofluorescence (purple arrows). Panels (K-O) show a lack of colocalization between BACE1 and phosphorylated-tau (p-Tau) in plaque-associated dystrophic neurites. In contrast to BACE1-labeled counterparts, p-tau-labeled dystrophic neurites do not exhibit any consistency with regard to their amount, morphology and spatial relationship to/among the amyloid plaques (M-O). p-Tau-labeled somata and dystrophic-like dendrites also exist away from neuritic plaques (O). Scale bar=50 μm in (A) applying for (B, C, F-J), equal to 25 μm for (K-O), and 100 μm for (D, E).
FIG. 5
FIG. 5
Representative images from a 34 year-old monkey showing colocalization of amyloidogenic proteins and β-amyloid peptides in dystrophic neurites and around neuritic plaques in the hippocampus (A-D) and neocortex (E-N). Panels (A-D) show colocalizations of BACE1 with Aβ40 (A, B) and Aβ42 (C, D) in consecutive hippocampal sections (20 μm thick). BACE1 ad Aβ labeled profiles are mostly present in the stratum radiatum (s.r.) and stratum lacunosum-moleculare (s.l.m.), and appear to match site-specifically in most cases between the two sections (examples are marked with frames and arrows). In double immunofluorescence, BACE1 labeling in dystrophic neurites coexists with local extracellular Aβ deposits visualized by 3D6 (E-G) and 12F4 (H, I). BACE1 and Aβ labelings interpose around virtually all primitive neuritic plaques (cycled profiles in E-I). A centroperipheral gradient of high to low Aβ IR around cored plaques is illustrated by using a short (30 miniseconds, H) and slightly longer (100 miniseconds, I) exposure for Aβ imaging. BACE1 and Aβ IR may colocalize inside small isolated swollen processes that are not surrounded by clear extracellular Aβ deposits (profiles pointed by arrows in E-G). BACE1 coexists commonly with amyloid precursor protein (APP) (J-L) and presenilin-1 (PS1) (M, N) in dystrophic neurites appearing as small “solid” as well as large “cavitied” clusters (J-N), or isolated swollen processes (arrows, in J). Bisbenzimide (Bis) nuclear counterstain is shown in blue in some images (J, L, M). Blood vessels (as labeled with asterisks in C, D) are used as landmarks to identify profiles between consecutive sections. Sub: subiculum; ML: molecular layer; mf: mossy fiber; GCL: granular cell layer; hf: hippocampal fissure. Scale bar=1.5 mm in (A) applying to (B), equal to 500 μm for (C, D), 250 μm for (E-G), 100 μm for (H-K, M, N) and 50 μm for (L).
FIG. 6
FIG. 6
Localization of increased BACE1 IR to dystrophic axon terminals in aged monkey cortex. BACE1-labeled neurites do not colocalize with microtubule associated protein-2 (MAP2) (A-C), but colocalize with synaptophysin (D-F). A subset of BACE1-labeled dystrophic neurites coexpress vesicular glutamate transporter-1 (VGLUT1) (G-I), choline acetyltransferase (ChAT) (J-L2) and parvalbumin (M, M′). Note that the expression of the latter specific neuronal markers appears to be variable among the labeled neurites (examples are pointed by short and long arrows in I, L2, M′). γ-Aminobutyric acid (GABA) transporter-1 (GAT1) is barely detectable in BACE1-labeled dystrophic neurites (N, N′). Scale bar=100 μm in (A-L, M and N), and 50 μm for (L1, L2, M′ and N′).
FIG. 7
FIG. 7
Paravascular distribution of BACE1-labeled dystrophic neurites in aged monkey cortex. Panels (A, B) show clusterized neurites apposing to and extending across blood vessels (marked with asterisks). Panels (C, C1-10) show examples of small neuritic clusters and isolated spherical or process-like elements (arrows) close to and coiling around blood vessels. Nicotinamide adenine dinucleotide phosphate diaphorase (NADPH-d) reactivity occurs in subset of BACE1-labeled neurites (B, C2, C7, C8, D-I), more clear in those with a lighter NADPH-d reaction (F, G). The dystrophic neurites are present in layer I (H, I). Panel (J) illustrates the method for quantifying blood vessel intervals by measuring the distances between neighboring vascular intersections along the equal-dividing (diagonal, horizontal and vertical) lines of the image. Image inserts in (K) show the method for measuring the longest and shortest vertical distances of individual neuritic clusters to the nearest blood vessel. The line graph (K) plots the longest and shortest distances of the measured clusters (n=237, with a diameter ≥ 5 μm) as a function of their diameters. Note the trend of upward shift of the longest distance with the increase of cluster size. The bar graph (L) summarizes the means of longest distances (long. dist.) and the vascular distances (vas. dist.) in the aged monkeys with (+, n=3) and without (-, n=3) cerebral plaques. Statistical analyses and results are indicated. Scale bar =100 μm in (A) applying to (H, I), equivalent to 50 μm for (B-G) and 250 μm for (J).
FIG. 8
FIG. 8
Analysis of the paravascular distribution of BACE1-labeled dystrophic neurites in aged monkey (A-C, H) and AD human (D-G, I) cortices in dual immunolabeling for BACE1 and collagen-IV. (A-C) show examples of VIP-visualized BACE1-expressing neuritic clusters (purple) tightly apposing collagen-labeled blood vessels (DAB reaction, brown) in a temporal cortical area of the 31-year old monkey (M-31-yr). Large and small neuritic clusters are pointed by arrowheads and a small arrow (B, C). In panels (D-G), BACE1 and collagen-IV immunoreactivities are concurrently visualized with the biotinylated horse IgG against mouse, rabbit and goat IgGs (Vector labs). BACE1-labeled neuritic clusters (arrowheads) occur around blood vessels (D-F). BACE1-labeled neurites appear as granule-like and short/small swollen elements around potential “burn-out” amyloid plaques especially in AD cases with heavier plaque pathology (G). Dot-graphs (H, I) show the numerical distribution of the longest vertical distances (red cycles) to the nearest blood vessels for individual neuritic clusters relative to vascular intervals (green triangles) intercrossing the diagonal lines measured in the same set of images. Mean comparisons (blue bars) yielded significant difference between the longest distances and vascular intervals in all analyzed monkey and AD cases. The ratio and percentage of neuritic clusters in contact with blood vessels (based on visual scoring) are given for each case. Scale bar=150 μm in (A) applying to (B, C) as 300 μm and (D-G) as 200 μm.

Similar articles

Cited by

References

    1. Attwell D, Laughlin SB. An energy budget for signaling in the grey matter of the brain. J Cereb Blood Flow Metab. 2001;21:1133–1145. - PubMed
    1. Boche D, Zotova E, Weller RO, Love S, Neal JW, Pickering RM, Wilkinson D, Holmes C, Nicoll JA. Consequence of Abeta immunization on the vasculature of human Alzheimer's disease brain. Brain. 2008;131:3299–3310. - PubMed
    1. Chow VW, Savonenko AV, Melnikova T, Kim H, Price DL, Li T, Wong PC. Modeling an anti-amyloid combination therapy for Alzheimer's disease. Sci Transl Med. 2010;2:13ra1. - PMC - PubMed
    1. Chu Y, Kordower JH. Age-associated increases of alpha-synuclein in monkeys and humans are associated with nigrostriatal dopamine depletion: Is this the target for Parkinson's disease? Neurobiol Dis. 2007;25:134–149. - PubMed
    1. Cohen AD, Price JC, Weissfeld LA, James J, Rosario BL, Bi W, Nebes RD, Saxton JA, Snitz BE, Aizenstein HA, Wolk DA, Dekosky ST, Mathis CA, Klunk WE. Basal cerebral metabolism may modulate the cognitive effects of Abeta in mild cognitive impairment: an example of brain reserve. J Neurosci. 2009;29:14770–14778. - PMC - PubMed

Publication types

MeSH terms