Adoptive transfer of splenocytes to study cell-mediated immune responses in hepatitis C infection using HCV transgenic mice
- PMID: 20727132
- PMCID: PMC2936292
- DOI: 10.1186/1476-5926-9-7
Adoptive transfer of splenocytes to study cell-mediated immune responses in hepatitis C infection using HCV transgenic mice
Abstract
Background: Hepatitis C virus (HCV) is a major cause of chronic hepatitis and a health problem affecting over 170 million people around the world. We previously studied transgenic mice that express HCV Core, Envelope 1 and Envelope 2 proteins predominantly in the liver, resulting in steatosis, liver and lymphoid tumors, and hepatocellular carcinoma. Herein, the immune-mediated cell response to hepatitis C antigens was evaluated by adoptive transfers of carboxyfluorescein succinimidyl ester (CFSE) labelled splenocytes from HCV immunized mice into HCV transgenic mice.
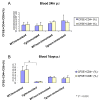
Results: In comparison to non-transgenic mice, there was a significant decrease in the percentage of CFSE-labeled CD4+ and CD8+ T cells in transgenic mouse peripheral blood receiving adoptive transfers from immunized donors. Moreover, the percentage of CFSE-labeled CD4+ and CD8+ T cells were significantly higher in the spleen of transgenic and non-transgenic mice when they received splenocytes from non-immunized than from immunized mice. On the other hand, the percentages of CD4+ and CD8+ T cells in the non-transgenic recipient mouse lymph nodes were significantly higher than the transgenic mice when they received the adoptive transfer from immunized donors. Interestingly, livers of transgenic mice that received transfers from immunized mice had a significantly higher percentage of CFSE labeled T cells than livers of non-transgenic mice receiving non-immunized transfers.
Conclusions: These results suggest that the T cells from HCV immunized mice recognize the HCV proteins in the liver of the transgenic mouse model and homed to the HCV antigen expression sites. We propose using this model system to study active T cell responses in HCV infection.
Figures


Similar articles
-
Genetic immunization of wild-type and hepatitis C virus transgenic mice reveals a hierarchy of cellular immune response and tolerance induction against hepatitis C virus structural proteins.J Virol. 2001 Dec;75(24):12121-7. doi: 10.1128/JVI.75.24.12121-12127.2001. J Virol. 2001. PMID: 11711603 Free PMC article.
-
Inducing oral immune regulation of hepatitis B virus envelope proteins suppresses the growth of hepatocellular carcinoma in mice.Cancer. 2002 Jan 15;94(2):406-14. doi: 10.1002/cncr.10237. Cancer. 2002. PMID: 11900226
-
[Enhancement of cellular immune response to DNA vaccine encoding hepatitis C virus core and envelope 2 fusion antigen by murine Fms-like tyrosine kinase 3 ligand].Sheng Wu Gong Cheng Xue Bao. 2003 Mar;19(2):158-62. Sheng Wu Gong Cheng Xue Bao. 2003. PMID: 15966314 Chinese.
-
Chronic ethanol diet increases regulatory T-cell activity and inhibits hepatitis C virus core-specific cellular immune responses in mice.Hepatol Res. 2014 Jul;44(7):788-97. doi: 10.1111/hepr.12173. Epub 2013 Jul 4. Hepatol Res. 2014. PMID: 23710581 Free PMC article.
-
T cells expressing a chimeric antigen receptor that binds hepatitis B virus envelope proteins control virus replication in mice.Gastroenterology. 2013 Aug;145(2):456-65. doi: 10.1053/j.gastro.2013.04.047. Epub 2013 Apr 30. Gastroenterology. 2013. PMID: 23639914
Cited by
-
Enhanced anti-tumor efficacy of electroporation (EP)-mediated DNA vaccine boosted by allogeneic lymphocytes in pre-established tumor models.Cancer Immunol Immunother. 2024 Oct 3;73(12):248. doi: 10.1007/s00262-024-03838-8. Cancer Immunol Immunother. 2024. PMID: 39358555 Free PMC article.
-
Dendritic cells in hepatitis C infection: can they (help) win the battle?J Gastroenterol. 2011 Apr;46(4):432-47. doi: 10.1007/s00535-011-0377-y. Epub 2011 Feb 17. J Gastroenterol. 2011. PMID: 21327958 Review.
-
Immunization with a Borrelia burgdorferi BB0172-derived peptide protects mice against lyme disease.PLoS One. 2014 Feb 5;9(2):e88245. doi: 10.1371/journal.pone.0088245. eCollection 2014. PLoS One. 2014. PMID: 24505447 Free PMC article.
-
Autologous iPSC-Based Vaccines Elicit Anti-tumor Responses In Vivo.Cell Stem Cell. 2018 Apr 5;22(4):501-513.e7. doi: 10.1016/j.stem.2018.01.016. Epub 2018 Feb 15. Cell Stem Cell. 2018. PMID: 29456158 Free PMC article.
References
-
- Liang TJ, Rehermann B, Seeff LB, Hoofnagle JH. Pathogenesis, natural history, treatment, and prevention of hepatitis C. Ann Intern Med. 2000;132:296–305. - PubMed
-
- He XS, Rehermann B, Lopez-Labrador FX, Boisvert J, Cheung R, Mumm J, Wedemeyer H, Berenguer M, Wright TL, Davis MM, Greenberg HB. Quantitative analysis of hepatitis C virus-specific CD8(+) T cells in peripheral blood and liver using peptide-MHC tetramers. Proc Natl Acad Sci USA. 1999;96:5692–5697. doi: 10.1073/pnas.96.10.5692. - DOI - PMC - PubMed
-
- Nuti S, Rosa D, Valiante NM, Saletti G, Caratozzolo M, Dellabona P, Barnaba V, Abrignani S. Dynamics of intra-hepatic lymphocytes in chronic hepatitis C: enrichment for Valpha24+ T cells and rapid elimination of effector cells by apoptosis. Eur J Immunol. 1998;28:3448–3455. doi: 10.1002/(SICI)1521-4141(199811)28:11<3448::AID-IMMU3448>3.0.CO;2-5. - DOI - PubMed
LinkOut - more resources
Full Text Sources
Research Materials
