. 2010 Aug 20:7:196.
doi: 10.1186/1743-422X-7-196.

What happened after the initial global spread of pandemic human influenza virus A (H1N1)? A population genetics approach

Affiliations

What happened after the initial global spread of pandemic human influenza virus A (H1N1)? A population genetics approach

Fernando Martinez-Hernandez et al. Virol J. .

Abstract

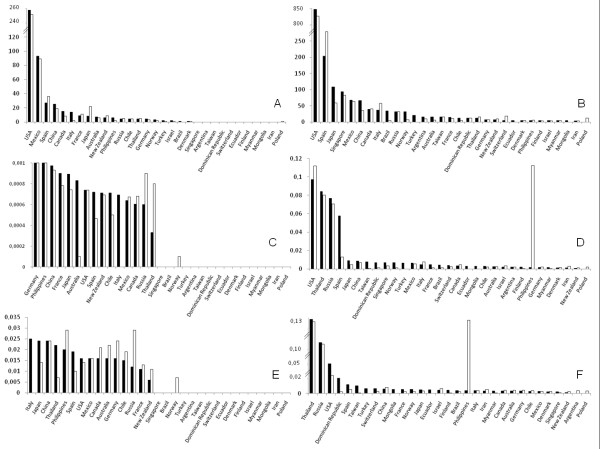
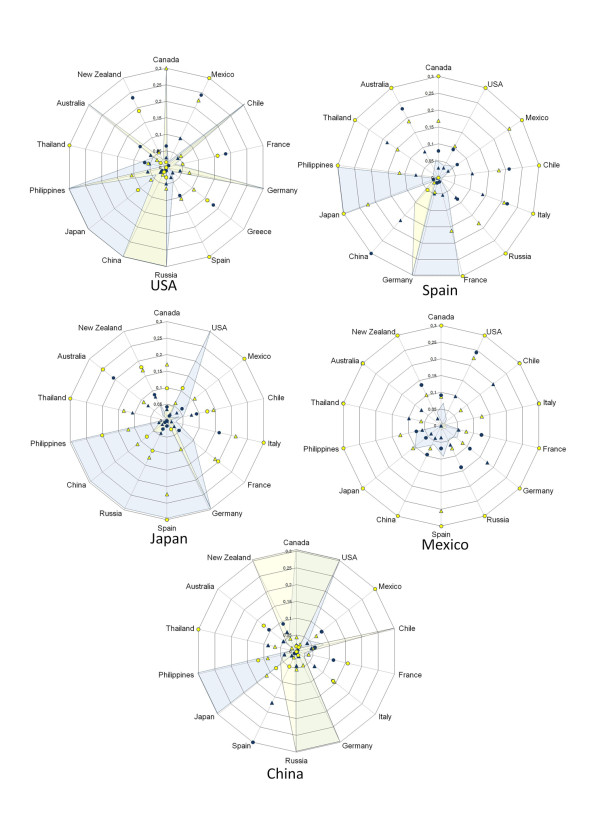
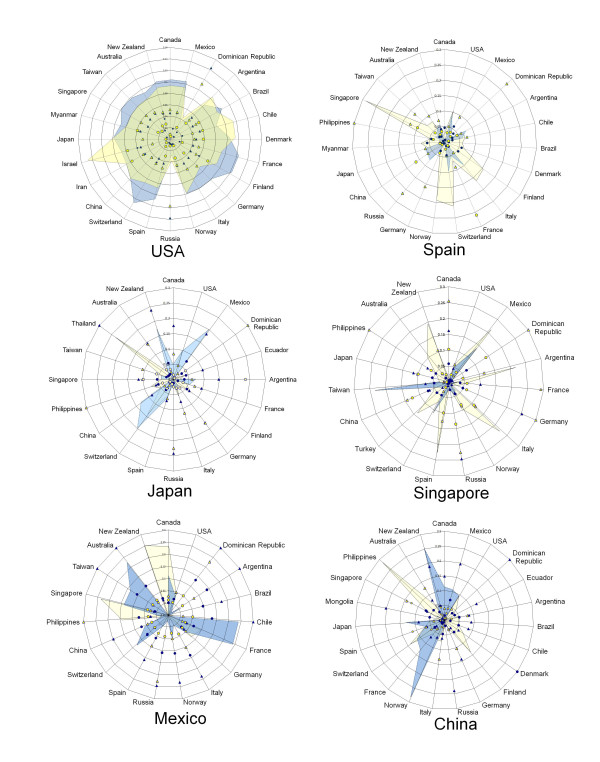
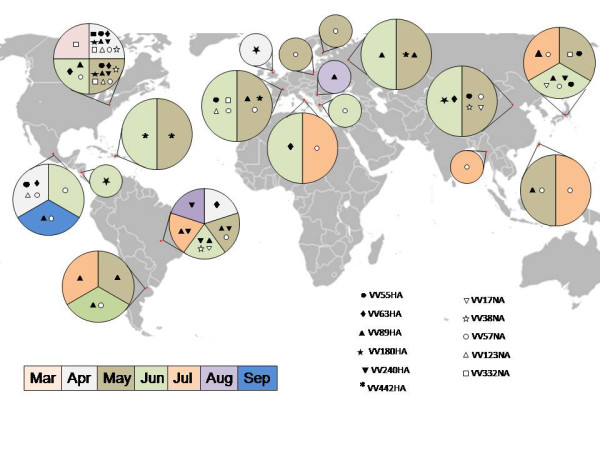
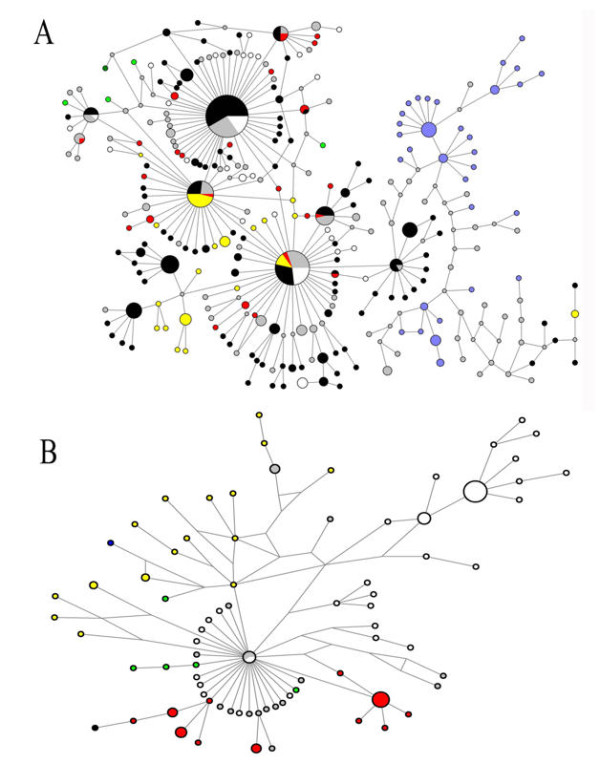
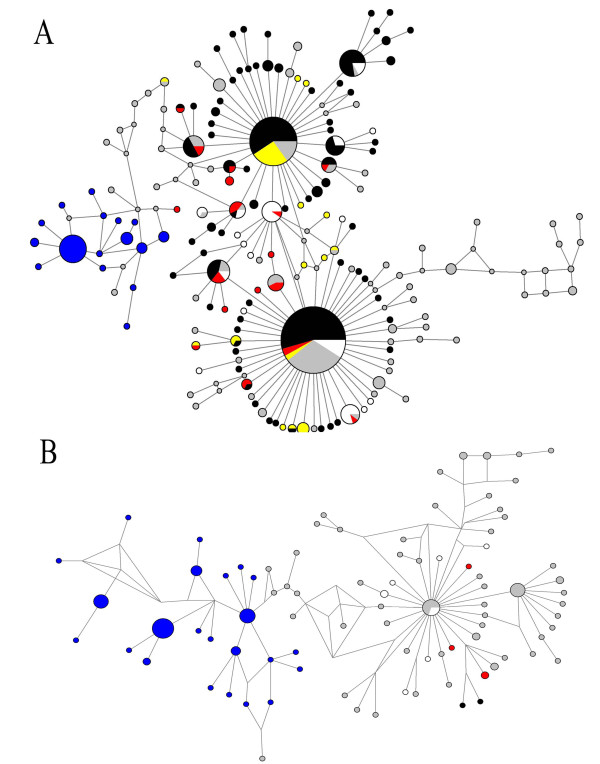
Viral population evolution dynamics of influenza A is crucial for surveillance and control. In this paper we analyzed viral genetic features during the recent pandemic caused by the new influenza human virus A H1N1, using a conventional population genetics approach based on 4689 hemagglutinin (HA) and neuraminidase (NA) sequences available in GenBank submitted between March and December of 2009. This analysis showed several relevant aspects: a) a scarce initial genetic variability within the viral isolates from some countries that increased along 2009 when influenza was dispersed around the world; b) a worldwide virus polarized behavior identified when comparing paired countries, low differentiation and high gene flow were found in some pairs and high differentiation and moderate or scarce gene flow in others, independently of their geographical closeness, c) lack of positive selection in HA and NA due to increase of the population size of virus variants, d) HA and NA variants spread in a few months all over the world being identified in the same countries in different months along 2009, and e) containment of viral variants in Mexico at the beginning of the outbreak, probably due to the control measures applied by the government.


Figures

Figure 1
Figure 1
Number of sequences and influenza variants of HA and NA identified monthly along 2009. Full bars correspond to HA sequences, empty bars to NA sequences; left dash bars to HA variants and right dash bars to NA variants.
Figure 2
Figure 2
Number of influenza sequences of HA (full bars) and NA (empty bars) reported during the initial four months (2A) and for the global analysis (2B), θ values found for the same sequences and periods are seen in figures 2C and 2D, while π values are in figures 2E and 2F.
Figure 3
Figure 3
Radial plots of countries with HA and NA reported along the first four months (April-July, 2009) of the pandemic show population genetic indexes from countries that reported the higher number of influenza sequences paired against all those countries with A H1N1. Yellow and blue areas correspond to gene flow (Nm × 102) for HA and NA respectively; triangles correspond to FST values, full for HA and empty for NA; circles correspond to GST values, full for HA and empty for NA. In order to facilitate viewing all values above 3 they are seen as 3.
Figure 4
Figure 4
Radial plots of countries with HA and NA reported between April and December 2009 show population genetic indexes from countries that reported the higher number of influenza sequences paired against all those with A H1N1. Yellow and blue areas correspond to gene flow (Nm × 102) for HA and NA respectively; triangles correspond to FST values, full for HA and empty for NA; circles correspond to GST values, full for HA and empty for NA. In order to facilitate viewing all values 3 or above are seen as 3.
Figure 5
Figure 5
World map showing HA and NA influenza variants found in more than three countries along the study. Full geometric figures correspond to HA sequences; empty to NA.
Figure 6
Figure 6
Median joining network showing the HA variants identified during the first four months (A) or from July to December (B).The sizes of circles represent the frequency of VV. In black variants from USA, blue Spain, white Japan, green Singapore, yellow Mexico, red China and grey from other countries.
Figure 7
Figure 7
Median joining network showing the NA variants identified during the first four months (A) or from July to December (B).The sizes of circles represent the frequency of VV. In black variants from USA, blue Spain, white Japan, green Singapore, yellow Mexico, red China and grey from other countries.

Similar articles

Cited by

References

    1. Perez-Padilla R, de la Rosa-Zamboni D, Ponce de Leon S, Hernandez M, Quiñones-Falconi F, Bautista E, Ramirez-Venegas A, Rojas-Serrano J, Ormsby CE, Corrales A, Higuera A, Mondragon E, Cordova-Villalobos JA. INER Working Group on Influenza. Pneumonia and respiratory failure from swine-origin influenza A (H1N1) in Mexico. N Engl J Med. 2009;361:680–689. doi: 10.1056/NEJMoa0904252. - DOI - PubMed
    1. WHO influenza update page. http://www.who.int/csr/don/2009_05_04a/en/index.html
    1. Bansal S, Pourbohloul B, Grenfell B, Meyers LA. The shifting demographic landscape of influenza. PLoS Curr Influenza. 2009;1:RRN1047. - PMC - PubMed
    1. Lemey P, Suchard M, Rambaut A. Reconstructing the initial global spread of a human influenza pandemic: a Bayesian spatial-temporal model for the global spread of H1N1pdm. PLoS Curr Influenza. 2009;2:RRN1031. - PMC - PubMed
    1. Nelson M, Spiro D, Wentworth D, Beck E, Fan J, Ghedin E, Halpin R, Bera J, Hine E, Proudfoot K, Stockwell T, Lin X, Griesemer S, Kumar S, Bose M, Viboud C, Holmes E, Henrickson K. The early diversification of influenza A/H1N1pdm. PLoS Curr Influenza. 2009;3:RRN1126. - PMC - PubMed

Publication types

MeSH terms

Substances