. 2010 Oct 8;402(5):905-18.
doi: 10.1016/j.jmb.2010.08.010. Epub 2010 Aug 18.

Multifactorial determinants of protein expression in prokaryotic open reading frames

Affiliations

Multifactorial determinants of protein expression in prokaryotic open reading frames

Malin Allert et al. J Mol Biol. .

Abstract

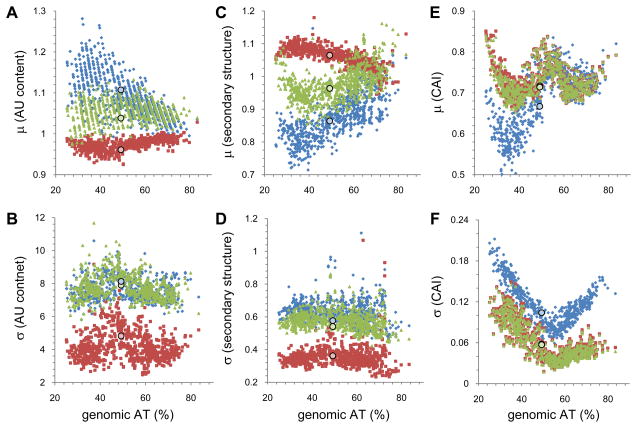
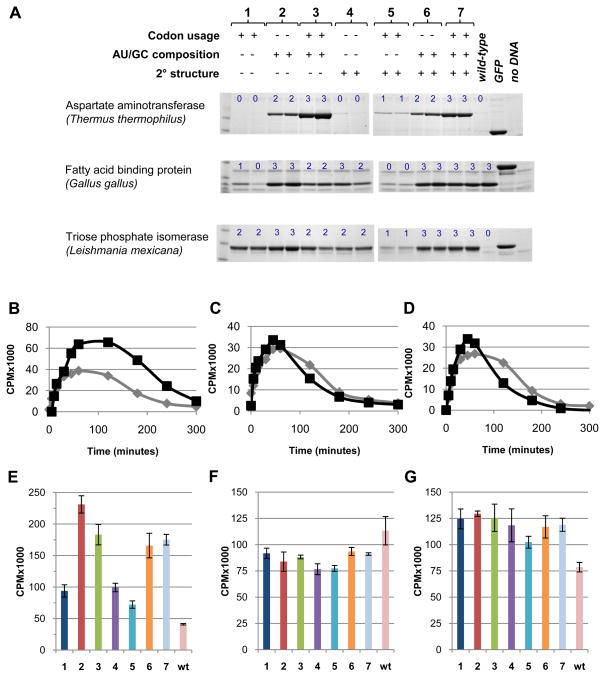
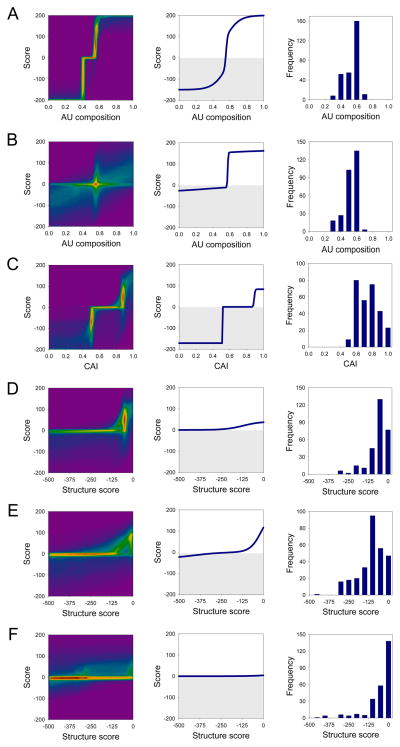
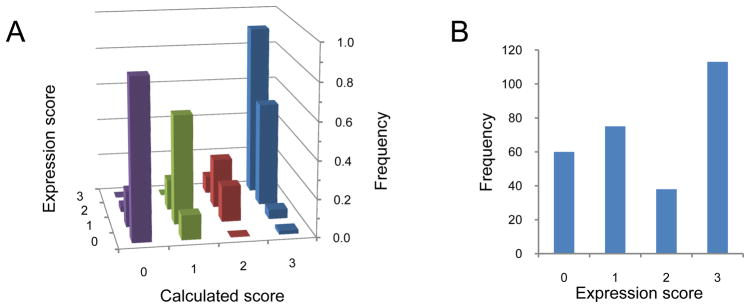
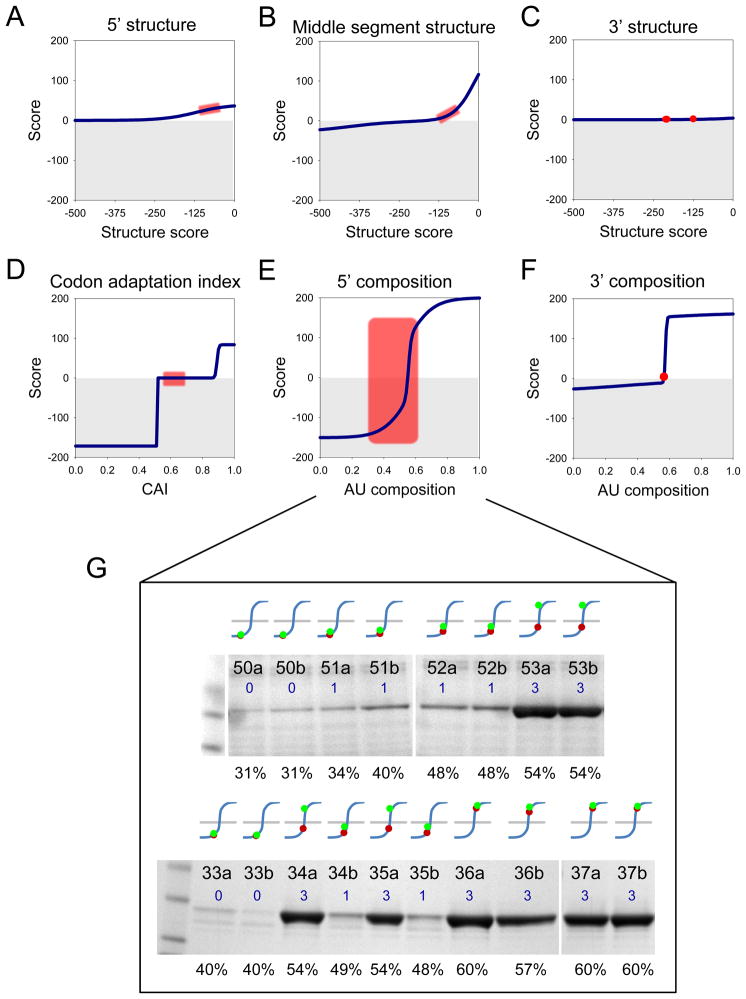
A quantitative description of the relationship between protein expression levels and open reading frame (ORF) nucleotide sequences is important for understanding natural systems, designing synthetic systems, and optimizing heterologous expression. Codon identity, mRNA secondary structure, and nucleotide composition within ORFs markedly influence expression levels. Bioinformatic analysis of ORF sequences in 816 bacterial genomes revealed that these features show distinct regional trends. To investigate their effects on protein expression, we designed 285 synthetic genes and determined corresponding expression levels in vitro using Escherichia coli extracts. We developed a mathematical function, parameterized using this synthetic gene data set, which enables computation of protein expression levels from ORF nucleotide sequences. In addition to its practical application in the design of heterologous expression systems, this equation provides mechanistic insight into the factors that control translation efficiency. We found that expression is strongly dependent on the presence of high AU content and low secondary structure in the ORF 5' region. Choice of high-frequency codons contributes to a lesser extent. The 3' terminal AU content makes modest, but detectable contributions. We present a model for the effect of these factors on the three phases of ribosomal function: initiation, elongation, and termination.


Conflict of interest statement

Conflict of interest

The authors declare that they have no conflict of interest.

Figures

Figure 1
Figure 1. Genomic averages and variances of regional ORF nucleotide composition, RNA secondary structure, and codon adaptation index
All parameters are shown as mean values and variances calculated over all ORFs within a genome. Blue, 5′ ORF region (first 35 bases); red, middle region; green, 3′ ORF region (last 35 bases). Circles indicate the values of these parameters calculated for E. coli strain K-12 DH10B. (A) Mean ORF regional nucleotide composition is reported as the ratio of the composition of that region to that of the genome average. (B) Variances of the mean genomic regional nucleotide compositions. (C) Mean ORF regional secondary structure content is reported as the ratio of a region relative to the genome average. (D) Variances of the mean ORF regional secondary structure content. (E) Mean regional codon adaptation indices. (F) Variances of the regional genomic CAI values.
Figure 2
Figure 2. Experimental expression levels of synthetic genes determined using E. coli coupled in vitro transcription and translation reactions
(A) Synthetic genes were designed by optimizing CAI, mRNA secondary structure, and 5′ ORF regional nucleotide composition singly or in combination giving a total of seven conditions. For each condition, the expression pattern of two alleles differing by at least 10 mutations are shown. Three proteins differing in size, structure, origin and expression of wild-type ORF sequences were used: asparate aminotransferase (ttAST), fatty acid binding protein (ggFABP), and triose phosphate isomerase (lmTIM). Proteins were purified from coupled in vitro transcription and translation (TnT) reactions using immobilized metal affinity chromatography and run on 4–12% SDS-PAGE gradient gels. Green florescent protein template was included as a positive control for protein expression levels and an extract without added DNA as a negative control. Observed expression levels were classified into one of four categories (blue numbers: 0, no band; 1, weak band; 2, medium band; 3, strong band). Full gel images are shown in Figure S1. The identity of the observed protein band was verified by mass spectrometry for each of the three proteins in the first allele of the optimization condition 7 (Figure S2). (B–D) Time course of radiolabeled RNA in TnT reactions containing a high- (black) and low- (grey) expression level allele (background of a reaction without added DNA was substracted): ttAST (B), ggFABP (C), lmTIM (D). (E–G) Total radiolabeled RNA at one hour using one allele for each condition presented in panel A and the wild-type sequences: ttAST (E), ggFABP (F), lmTIM (G).
Figure 3
Figure 3. Parameterization of a mathematical function that calculates protein expression levels from ORF sequence
The function is the sum of six pairs of sigmoids representing reward and penalty contributions of 5′ (A) and 3′ (B) ORF regional AU composition, the ORF codon adaptation index (C), 5′ (D), middle (E) and 3′ (F) ORF regional secondary structure content. The score of each component ranges [−200,200]; their sum is mapped onto the protein expression category as <−100→0 (no expression), [−100,0]→1 (low), [0,100]→2 (medium), >100→3 (high). Left column: density plot of the distribution of sigmoids in the ensemble of near-optimal solutions. False coloring indicates how many sigmoidal curve segments pass through a region (magenta, none < blue < green < yellow < red, high). These distributions give an indication of the uncertainty in the parameter set. For instance, although there are many solutions for the 3′ ORF regional composition (B), it is clear that all have a penalty (lower-left quadrant) and reward (upper-right quadrant) with a critical transition centered at ~56% (red peak). Middle column: sigmoids of the parameters set that best fits the data (grey area: penalty score values). Right column: distribution of parameters in the experimental dataset (note that for the C-terminal segment there are 29 alleles with secondary structure scores <−500, which are not shown).
Figure 4
Figure 4. Correlation between observed and calculated protein expression levels
(A) correlation between calculated and observed expression levels. The frequencies are normalized to 1 within each predicted category. For 69% of the data calculated and observed expression categories are accurately calculated (diagonal). The remainder is usually off by only one expression level category; (B) distribution of observed protein expression levels (0, no expression; 1, low expression; 2, medium expression; 3, high expression).
Figure 5
Figure 5. The effect of varying N-terminal AU content in the presence of (near-) constant other parameters
Eight alleles of ttAST (50a–53b; G, top) and ten alleles of lmTIM (33a–37b; G, bottom) were constructed in which the 5′ regional composition was varied from 31% to 60%AU content (E); while keeping the other five parameters near-constant in a range where they have little effect on the predicted expression score (A–D, F). Panels A–F show the range of values (red rectangles or circles) of the six parameters for the eighteen alleles, mapped on the scoring function parameterized by the optimal global fit (see Figure 3). Panel G shows the expression levels (blue numbers) of the eighteen alleles (identity indicated at the top of each lane; see Supplementary Table 2 and Supplementary Figure S1) determined in Coomassie-stained gels. The curves above each lane indicate the mapping of the allelic 5′ regional AU content (shown as percentage at the bottom of each lane) onto the scoring function for this parameter (blue line). Mapping of the allelic values is shown for two critical points: red dots, 55% AU content, obtained from the optimal global fit of all the data (see Figure 3A, middle); green dots, 53% AU content, corresponding to the lower limit observed in the range of near-optimal fits (see Figure 3A, left). The latter value exhibits a clear threshold transition for these alleles in these two proteins. In addition to illustrating the effect of transitioning through a threshold, these results show that the value of the nucleotide composition critical point is not yet determined precisely (2% uncertainty).

References

    1. Ingolia NT, Ghaemmaghami S, Newman JR, Weissman JS. Genome-wide analysis in vivo of translation with nucleotide resolution using ribosome profiling. Science. 2009;324:218–223. - PMC - PubMed
    1. Carothers JM, Goler JA, Keasling JD. Chemical synthesis using synthetic biology. Curr Opin Biotechnol. 2009;20:498–503. - PubMed
    1. Andrianantoandro E, Basu S, Karig DK, Weiss R. Synthetic biology: new engineering rules for an emerging discipline. Mol Syst Biol. 2006;2:2006 0028. - PMC - PubMed
    1. Jana S, Deb JK. Strategies for efficient production of heterologous proteins in Escherichia coli. Appl Microbiol Biotechnol. 2005;67:289–298. - PubMed
    1. Winkler WC, Breaker RR. Regulation of bacterial gene expression by riboswitches. Annu Rev Microbiol. 2005;59:487–517. - PubMed

Publication types

LinkOut - more resources