. 2010 Dec 1;270(1-2):134-42.
doi: 10.1016/j.heares.2010.08.006. Epub 2010 Aug 18.

Partial tripolar cochlear implant stimulation: Spread of excitation and forward masking in the inferior colliculus

Affiliations

Partial tripolar cochlear implant stimulation: Spread of excitation and forward masking in the inferior colliculus

Julie Arenberg Bierer et al. Hear Res. .

Abstract

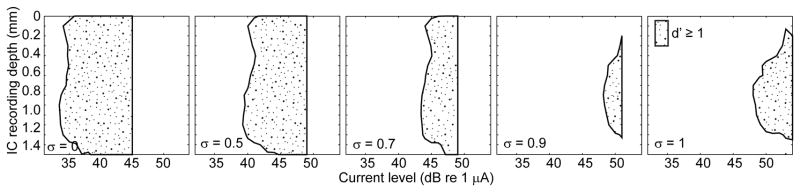
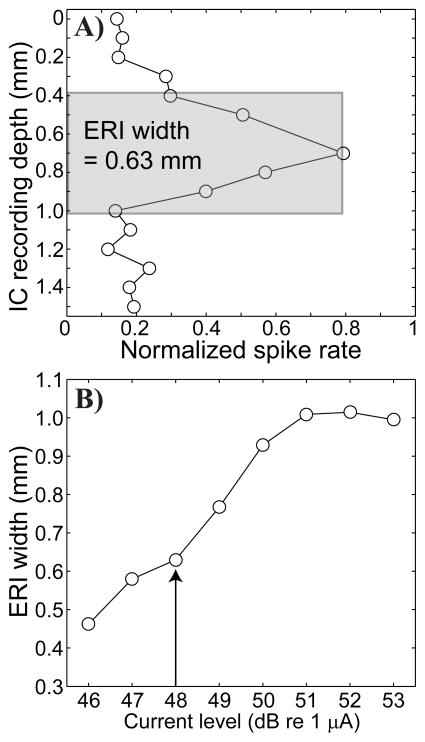
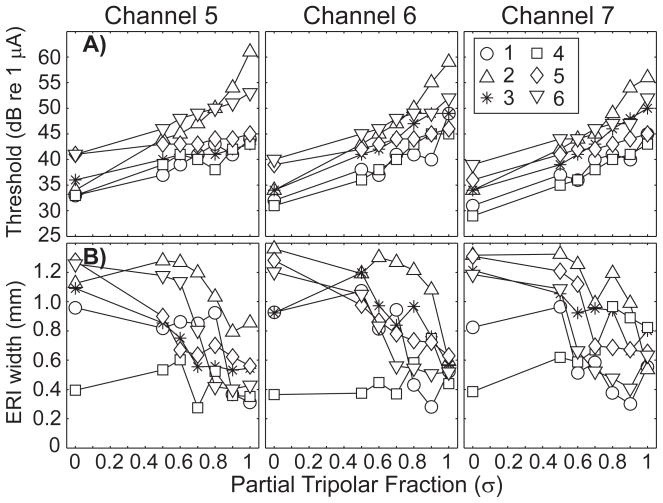
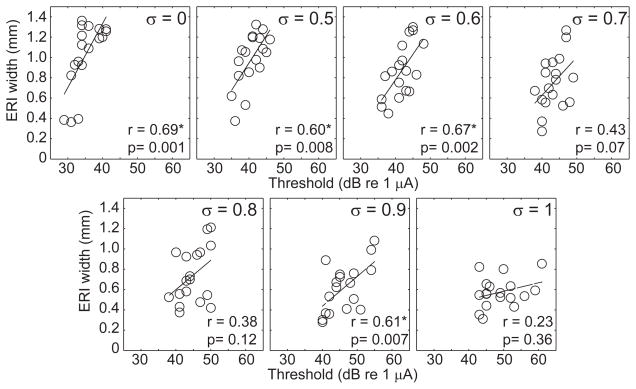
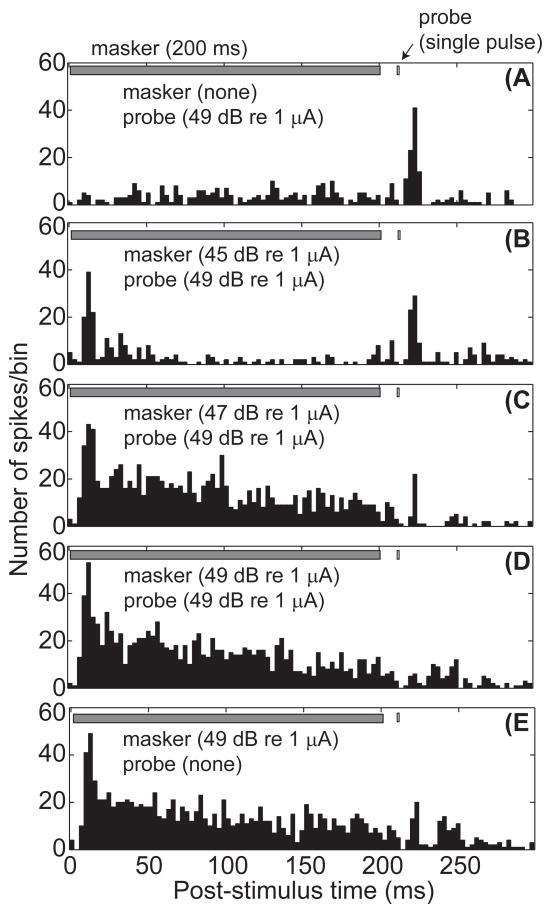
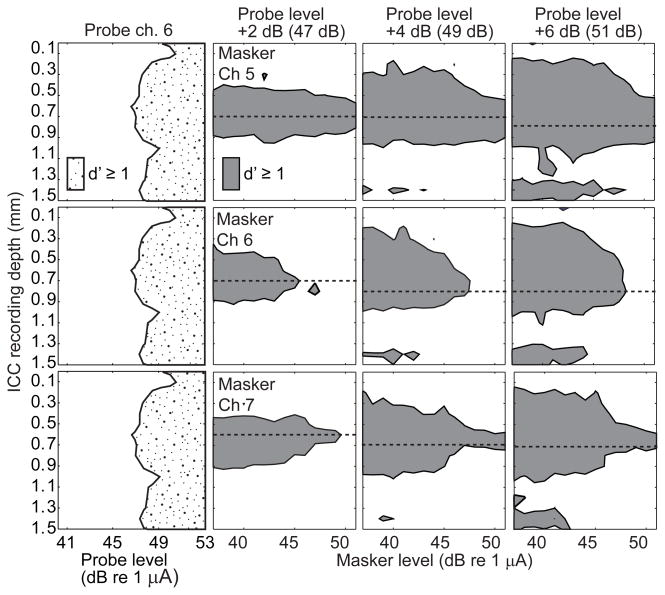
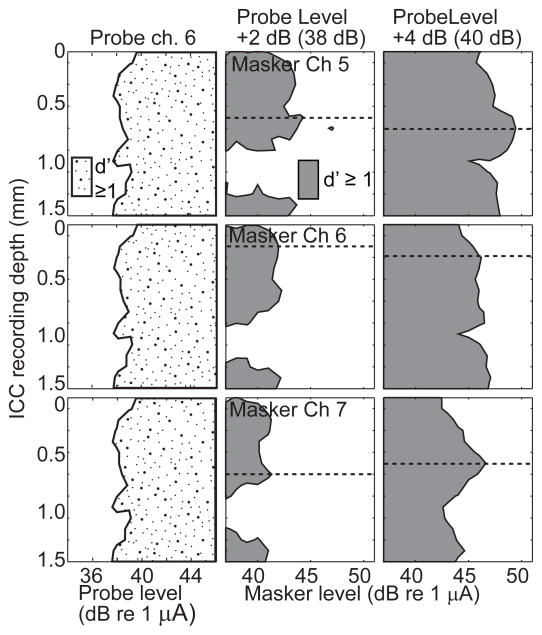
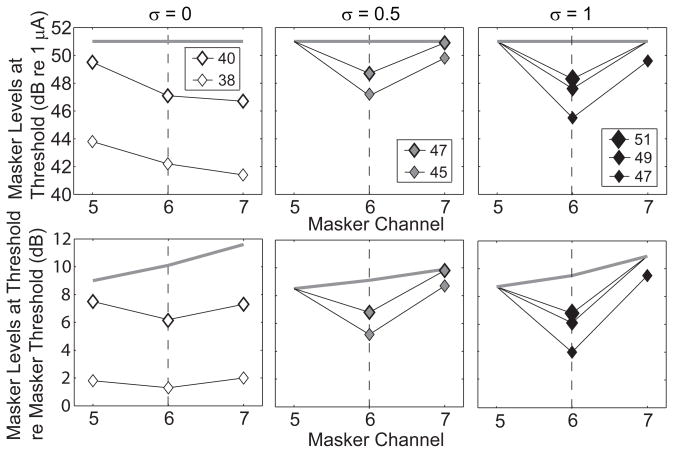
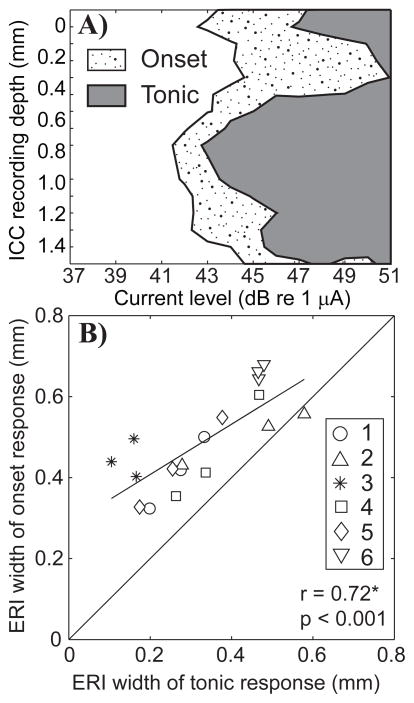
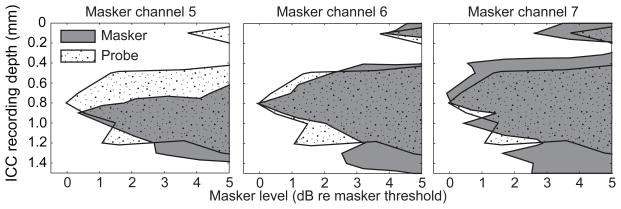
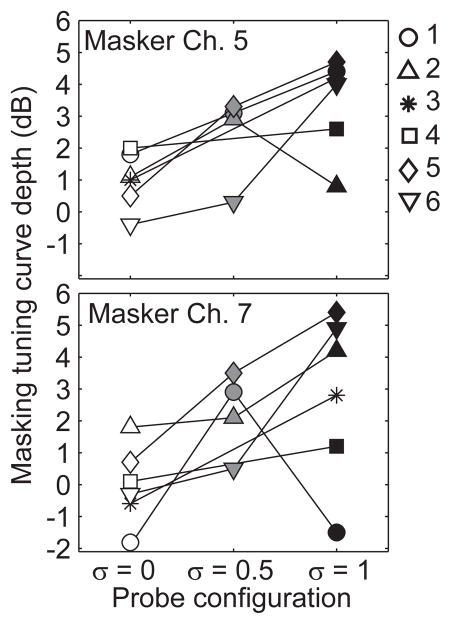
This study examines patterns of neural activity in response to single biphasic electrical pulses, presented alone or following a forward masking pulse train, delivered by a cochlear implant. Recordings were made along the tonotopic axis of the central nucleus of the inferior colliculus (ICC) in ketamine/xylazine anesthetized guinea pigs. The partial tripolar electrode configuration was used, which provided a systematic way to vary the tonotopic extent of ICC activation between monopolar (broad) and tripolar (narrow) extremes while maintaining the same peak of activation. The forward masking paradigm consisted of a 200 ms masker pulse train (1017 pulses per second) followed 10 ms later by a single-pulse probe stimulus; the current fraction of the probe was set to 0 (monopolar), 1 (tripolar), or 0.5 (hybrid), and the fraction of the masker was fixed at 0.5. Forward masking tuning profiles were derived from the amount of masking current required to just suppress the activity produced by a fixed-level probe. These profiles were sharper for more focused probe configurations, approximating the pattern of neural activity elicited by single (non-masked) pulses. The result helps to bridge the gap between previous findings in animals and recent psychophysical data.


Figures

Figure 1
Figure 1
Single-pulse spatial tuning curves. Each panel shows the distribution of neural activity along 16 recording sites in the inferior colliculus (ordinate) elicited by a single, biphasic pulse as a function of stimulus current level (abscissa) in decibels relative to 1 μA. The contour represents a cumulative discrimination index (d′) of at least one. The stippled area represents the range of ICC depths at which the neural response produced activity distinguishable from background with a criteria of d′=1; the right-most extent of each stippled area ends abruptly at the highest current level that was tested. Each panel shows the response to a single pulse with partial tripolar fraction that varied from 0 (left) to 1 (right) as indicated in the lower left corner of each panel. Responses are from cochlear implant channel 6 in GP3.
Figure 2
Figure 2
Single-pulse ICC image and equivalent rectangular (ERI) widths. A) This panel shows the distribution of normalized spike activity (abscissa) as a function recording depth in the ICC (ordinate). Data are from cochlear implant channel 6, using a stimulus level of 2 dB above threshold with a partial tripolar fraction of 1.0 in GP5. The grey shading indicates the equivalent rectangular image (ERI): a rectangle that is equivalent to the area under the image curve with the same height as the curve. The width of the ERI, 0.63 mm in this case, provides a measure of spread of activation. B) This panel shows ERI width (ordinate in mm) as a function of stimulus current level (dB re 1 μA). The vertical arrow indicates the ERI for 2 dB above threshold.
Figure 3
Figure 3
Neural thresholds and ERI widths. A) threshold of the most sensitive recording site (ordinate) as a function of partial tripolar fraction (abscissa) for three cochlear implant channels; 4 (left), 5 (middle), and 6 (right). B)ER I width (ordinate) as a function of partial tripolar fraction (abscissa) for the three cochlear implant channels tested. Subject number is indicated by symbol.
Fig. 4
Fig. 4
Relation of ERI and neural thresholds. ERI (ordinate) is plotted as a function of threshold (abscissa) for all of the partial tripolar fractions tested: from 0 (top left) to 1 (bottom right). Data from the three tested stimulus channels for each subject are plotted and included in the correlation analyses. Linear regressions are indicated by the solid lines.
Figure 5
Figure 5
Post-stimulus time histograms for forward masking stimuli. Each panel represents the post-stimulus time histogram for a given set of masker levels, with or without the fixed-level probe stimulus. The probe level was fixed at 49 dB re 1 μA, approximately 4 dB above the threshold for the probe alone. The average number of spikes per time bin (ordinate) is plotted as a function of post-stimulus time in ms (abscissa). Fig. 5a shows the response to the single pulse probe stimulus (A) with no masker present. Fig. 5b shows the response to a low level masker and the fixed level probe stimulus. Fig. 5c shows the response to a medium level masker and the fixed probe. Fig. 5d shows the response to a high level masker and the fixed probe. Fig. 5e shows the response to the high level masker with no probe stimulus. Responses are from GP5, with masker channel 6 at δ = 0.5 and probe channel 6 at δ = 1.
Figure 6
Figure 6
Forward masking spatial tuning curves with a tripolar probe. The left column of panels shows the neural response to the probe stimulus alone, with recording depth (ordinate) as a function of increasing probe level (abscissa). The remaining panels each show the neural response to the probe as a function of masker levels. The shaded area represents the range of ICC depths at which there was a detectable response to the probe across a range of masker levels at a criterion of d′=1. Areas to the right of the shaded area at each depth correspond to masker levels at which the probe was masked to below detectability. For all conditions the masker tripolar fraction was fixed at 0.5 and the probe had a tripolar fraction of one and was presented on channel 6. Within a column of panels the probe level is fixed as indicated at the top of each column. Within a row of panels the masker channel is fixed as indicated in the left panels. The horizontal dashed line in each panel indicates the recording site that was most sensitive to the masker and was used to calculate the forward masked profiles. Data are from GP5.
Figure 7
Figure 7
Forward masking spatial tuning curves with a monopolar probe. Conventions as in Fig. 6.
Figure 8
Figure 8
Forward masked profiles for the most sensitive recording site. Each panel shows the masker level (ordinate) required to just mask the probe as a function of masker channel (abscissa) for probe configurations of δ = 0 (left), δ = 0.5 (middle) and δ = 1 (right). The masker levels are in units of dB relative to a 1 μA in the top row and in dB relative to masker threshold in the bottom row. The probe level is represented by symbol size. The grey bar at indicates the maximum masker level tested. Symbols are plotted only if masking occurred within the limits of our stimulus set. Data are from GP5.
Figure 9
Figure 9
A) Spatial tuning curves for the onset and tonic portions of the masker response. Neural activity along 16 recording sites in the inferior colliculus (ordinate) is shown as a function of stimulus current level (abscissa) in dB re 1 μA. The area of each curve represents neural activity levels that were distinguishable from background levels with a criteria of d′ = 1. The stippled portion of the STC was computed by averaging the responses over the first 3 to 20 ms. The grey portion was computed by averaging the responses over the last 50 ms of the masker pulse train, from 150 to 200 ms. Data are from GP5. B) Equivalent rectangular image widths comparing the onset (ordinate) and tonic (abscissa) portions of the masker response. Subject number is indicated by symbol. Multiple symbols for each subject represent the three masker channels tested (5, 6, and 7). The masker configuration was fixed to δ = 0.5.
Figure 10
Figure 10
Spatial tuning curves for masker and probe stimuli. Spatial tuning curve conventions are as in Figs. 1 and 4, except that the abscissa is in units relative to the masker alone threshold. In each panel the response to the non-masked single pulse, fixed-level probe is shown by the stippled curve. The shaded areas are the tonic responses to the last 50 ms of the 200-ms maskers, presented through cochlear implant channels 5 (left), 6 (middle) and 7 (right). The masking stimuli were δ = 0.5, and the probe stimulus was δ = 1.0. Data are from GP5.
Figure 11
Figure 11
Depth of forward masked tuning curves. The depth of masked tuning curves is shown for the six tested subjects for the basal channel 5 (top) and apical 7 (bottom) as a function of probe configuration (abscissa). Depth of tuning was measured as the difference between masker levels required for off-channel maskers compared to on-channel maskers in dB (ordinate). The probe stimulus was always delivered to channel 6.

References

    1. Berenstein CK, Mens LH, Mulder JJ, Vanpoucke FJ. Current steering and current focusing in cochlear implants: comparison of monopolar, tripolar, and virtual channel electrode configurations. Ear Hear. 2008;29:250–260. - PubMed
    1. Bierer JA, Faulkner KF. Identifying cochlear implant channels with poor electrode-neuron interface: Partial tripolar, single-channel thresholds, and psychophysical tuning curves. Ear Hear. 2010;31(2):247–58. - PMC - PubMed
    1. Bierer JA, Middlebrooks JC. Auditory cortical images of cochlear-implant stimuli: dependence on electrode configuration. J Neurophysiol. 2002;87:478–492. - PubMed
    1. Boex C, Kos MI, Pelizzone M. Forward masking in different cochlear implant systems. J Acoust Soc Am. 2003;114:2058–2065. - PubMed
    1. Bonham BH, Litvak LM. Current focusing and steering: Modeling, physiology, and psychophysics. Hear Res. 2008;242:141–53. - PMC - PubMed

Publication types