. 2010 Oct 15;316(17):2993-3005.
doi: 10.1016/j.yexcr.2010.08.003. Epub 2010 Aug 19.

MT1-MMP-mediated basement membrane remodeling modulates renal development

Affiliations

MT1-MMP-mediated basement membrane remodeling modulates renal development

Karen S Riggins et al. Exp Cell Res. .

Abstract

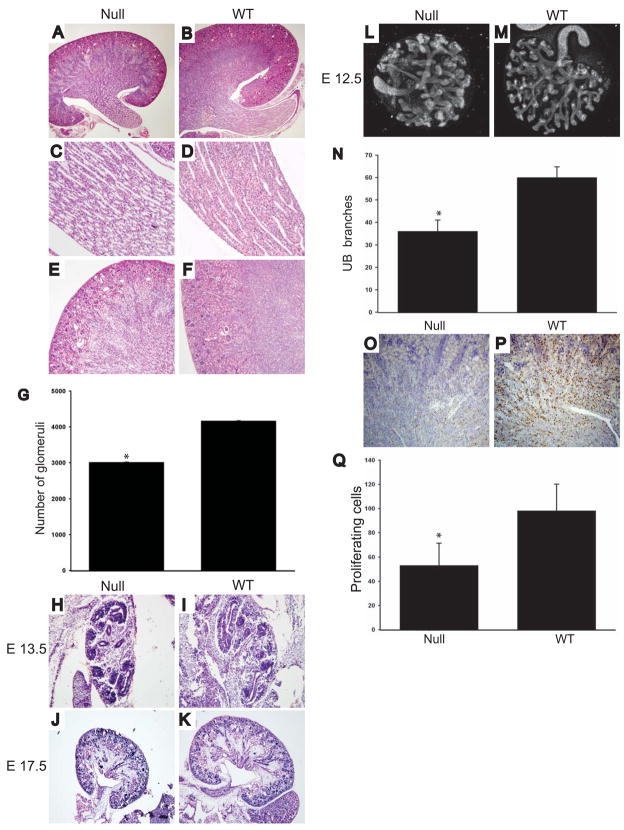
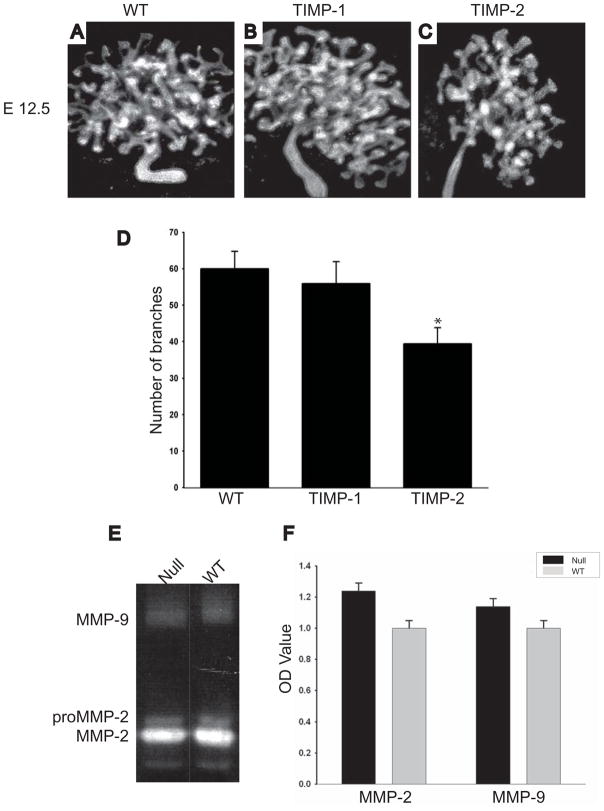
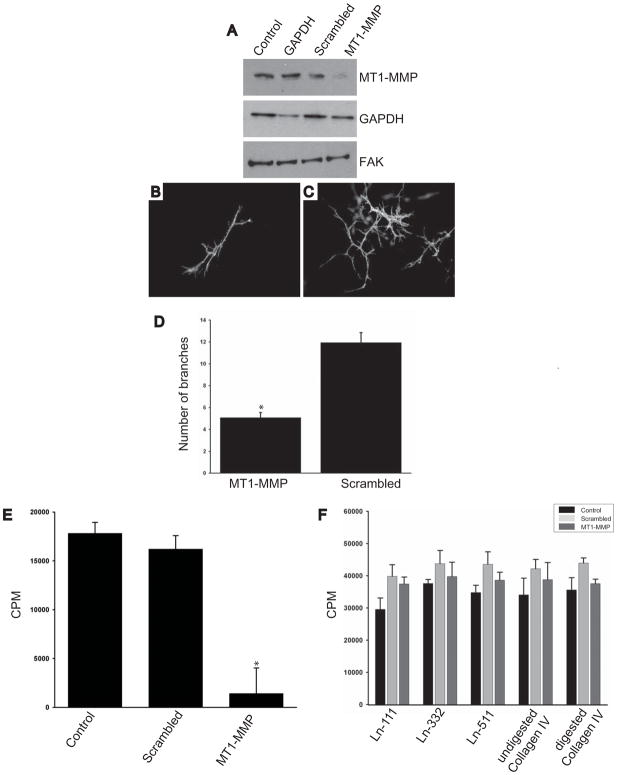
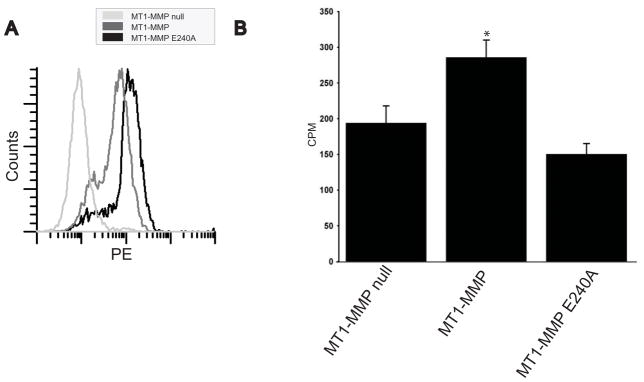
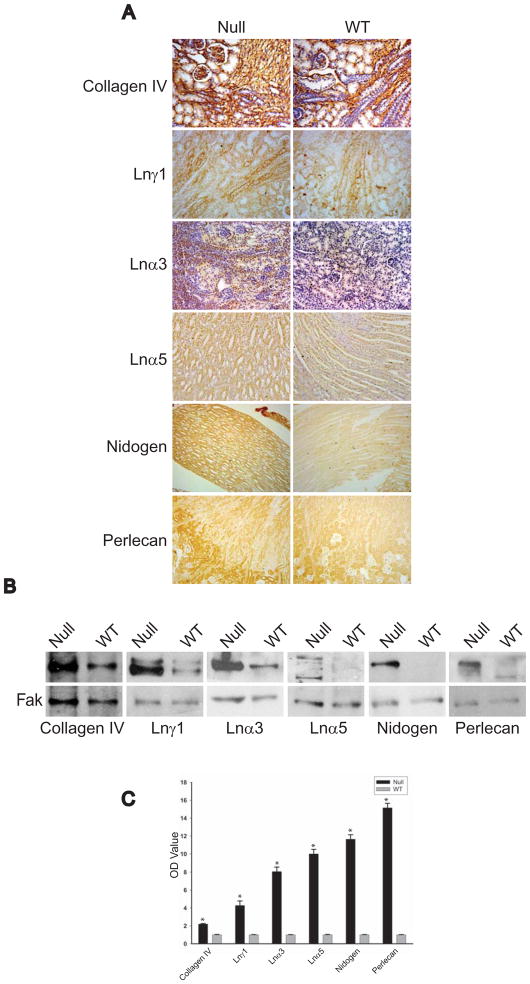
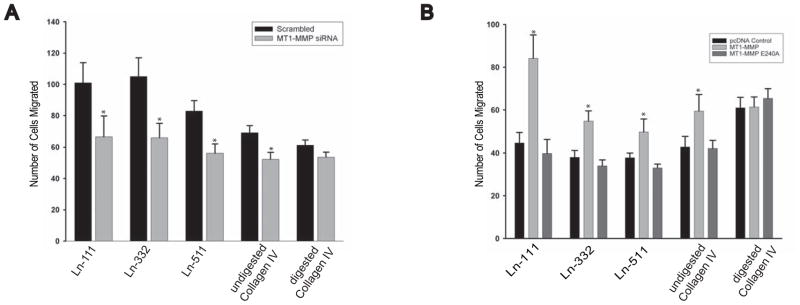
Extracellular matrix (ECM) remodeling regulates multiple cellular functions required for normal development and tissue repair. Matrix metalloproteinases (MMPs) are key mediators of this process and membrane targeted MMPs (MT-MMPs) in particular have been shown to be important in normal development of specific organs. In this study we investigated the role of MT1-MMP in kidney development. We demonstrate that loss of MT1-MMP leads to a renal phenotype characterized by a moderate decrease in ureteric bud branching morphogenesis and a severe proliferation defect. The kidneys of MT1-MMP-null mice have increased deposition of collagen IV, laminins, perlecan, and nidogen and the phenotype is independent of the MT-1MMP target, MMP-2. Utilizing in vitro systems we demonstrated that MTI-MMP proteolytic activity is required for renal tubule cells to proliferate in three dimensional matrices and to migrate on collagen IV and laminins. Together these data suggest an important role for MT1-MMP in kidney development, which is mediated by its ability to regulate cell proliferation and migration by proteolytically cleaving kidney basement membrane components.


Figures

Figure 1
Figure 1. Kidneys from MT1-MMP-null mice are dysmorphic and dysgenic
(A-F) Microscopy of hematoxylin and eosin stained kidney slides taken from P10 mice show decreased size of the MT1-MMP null (Null) relative to wild type (WT) mice (100x) (AB). Loosely packed, dilated and dysmorphic tubules were present in the papilla (400x) (C-D) and the cortico-medullary junction is poorly delineated and fewer glomeruli were evident in the MT1-MMP null kidneys (400X) (E-F). (G) The number of glomeruli in null and WT animals were determined as stated in the methods and expressed as the average+/− the standard deviation. A significant difference in the number of glomeruli between 5 mice from each genotype was present (p<0.05). (H-K) Hematoxilin and esoin stained slides of E13.5 (100X) (H-I) and E17.5 (100X) (J-K) shows that the MT1-MMP kidneys were smaller with a moderate UB branching defect. (L-N) E12.5 MT1-MMP and wild type kidneys were isolated, grown on transwells and stained for E-cadherin as described in the methods (L-M). The number of branches in 10 kidneys of MT1-MMP null and WT mice were counted and expressed as the average +/− the standard deviation. There was a significant difference in branch number between genotypes (p<0.05). (O-P) Cell proliferation in newborn kidneys from MT1-MMP null and WT mice was defined by Ki67 staining. The number of cells in 10 high powered fields in 4 mice per genotype was counted. The average and standard deviation is presented. * denotes a significant difference in proliferating cell number between genotypes (p<0.05) (P).
Figure 2
Figure 2. The branching morphogenesis kidney phenotype of the MT1-MMP-null mice is independent of MMP-2 and MMP-9 activity
(A-D) E12.5 kidneys of wild type mice in the presence of no inhibitor (A), TIMP-1 (B) or TIMP-2 (C) were grown on transwells as described in the methods and then stained with antibodies directed against E-cadherin. The number of branches in 10 kidneys in each group was counted and expressed as the average +/− the standard deviation (D). * denotes a significant decrease in branch number in kidneys grown in the presence of TIMP-2 relative to control (p<0.05). (E-F) An example of gelatin zymography performed on total kidney tissue lysates from 1 week-old MT1-MMP null and wild type mice show equal amounts of activated MMP-2 and MMP-9. The average and standard deviation of the O.D. of zymography performed on 5 mice in each group is demonstrated. No statistical differences were found between the two groups (F).
Figure 3
Figure 3. MT1-MMP is required for UB cells to proliferate and undergo tubulogenesis in vitro
(A-C) (A) UB cells were transfected with either an empty vector (control) or double-strand small interfering (si) RNA oligonucleotides against GAPDH, a scrambled peptide or MT1-MMP. Western blot analysis was performed 72 hours later utilizing primary antibodies against MT1-MMP, GAPDH or focal adhesion kinase (FAK) which was used as a loading control. A representative of four separate experiments is shown. (B-C) UB cells either treated with siRNA directed against MT1-MMP or a scrambled siRNA were placed in 3D-collagen I/matrigel gels and allowed to undergo branching morphogenesis as described in the methods. The number of branches in the different UB cell populations was counted in at least 3 wells in 5 different experiments and expressed as the average number of branches/tubular structure +/ the standard deviation (D). * denotes that significantly fewer branches were observed in the UB cells treated with siRNA directed against MT1-MMP (p<0.01). (E) UB cells treated with siRNA directed against MT1-MMP and scrambled siRNA were placed in 3D-collagen I/matrigel gels and proliferation was determined utilizing 3H thymidine as described in the methods. The average and standard deviation of 3 wells in 4 experiments is shown. * denotes a significant decrease in proliferation in UB cells treated with siRNA (p<0.05) (F). When control UB cells and UB cells treated with siRNA directed against MT1-MMP or scrambled siRNA were placed in onto laminin-111, laminin-332, laminin-511, trypsin digested collagen IV (α1α1α2) and undigested collagen IV (α1α1α2) shown 3D-collagen I/matrigel gels no differences in proliferation was seen as determined by tritiated thymidine.
Figure 4
Figure 4. MT1-MMP proteolytic activity is required for IMCD cells to proliferate in 3-dimensional collagen I/matrigel gels
(A) MT1-MMP-null inner medullary collecting duct cells were transfected with wild type or an E240/A mutant of MT1-MMP after which they were flow sorted for equal expression. (B) MT1-MMP-null, MT1-MMP-null reconstituted with MT1-MMP (MT1-MMP) or an E240/A mutant (MT1-MMP E240/A) inner medullary collecting duct cells were placed in 3D-collagen I/matrigel gels and proliferation was determined utilizing 3H-thymidine as described in the methods. The average and standard deviation of 3 wells in 4 experiments is shown. * denotes a significant increase in proliferation in IMCD cells expressing MT1-MMP (p<0.05).
Figure 5
Figure 5. Kidney BMs of MT1-MMP null mice have excessive amounts of ECM components
(A) Kidney sections from newborn MT1-MMP and wild type mice stained with specific antibodies to collagen IV (α1α1α2), laminin-111, laminin-α3, laminin-α5, nidogen, and perlecan. (B) Total kidney lysates (30 μg) of newborn mice were immunoblotted with antibodies directed against the proteins described above. Immunoblotting with an antibody against FAK was performed as a loading control. (C) Immunoblots of the BM proteins and FAK from newborn MT1-MMP and wild type mice were scanned, normalized and expressed as the relative intensity of MT1-MMP mice compared to wild type mice. The averages and standard deviations of 4 different mice are shown. * denotes a significant increase in the amount of basement membrane proteins in the MT1-MMP-null mice.
Figure 6
Figure 6. MT1-MMP proteolytic activity stimulates renal cell migration
(A) UB cells were subjected to either a scrambled siRNA or siRNA directed at MT1-MMP silencing and allowed to migrate on digested and undigested collagen IV (α1α1α2), laminin-111, laminin-332 or laminin 521 (all at 10 μg/ml) for 4 hours. The cells were counted at the end of this time and the number is expressed as cells/high power field. Values are the mean and standard deviation of three experiments performed in triplicate. * denotes statistically significant differences (P<0.05) between the two cell populations. (B) IMCD cells that were either null for MT1-MMP or were reconstituted with MT1-MMPor MT1-MMP E240/A were allowed to migrate on digested and undigested collagen IV (α1α1α2), laminin-111, laminin-332 or laminin 511 (all at 10 μg/ml) for 4 hours. The cells were counted at the end of this time and the number is expressed as cells/high power field. Values are the mean and standard deviation of three experiments performed in triplicate. * denotes statistically significant differences (P<0.05) between MT1-MMP null IMCD cells reconstituted with human MT1-MMP or MT1-MMP E240A.

Similar articles

Cited by

References

    1. Costantini F, Kopan R. Patterning a complex organ: branching morphogenesis and nephron segmentation in kidney development. Dev Cell. 2010;18:698–712. - PMC - PubMed
    1. Miner J. Renal basement membrane components. Kidney Int. 1999;56:2016–2024. - PubMed
    1. Itoh Y, Seiki M. MT1-MMP: a potent modifier of pericellular microenvironment. J Cell Physiol. 2006;206:1–8. - PubMed
    1. Lelongt BT, Murphy G, Ronco G, PM Matrix metalloproteinases MMP2 and MMP9 are produced in early stages of kidney morphogenesis but only MMP9 is required for renal organogenesis in vitro. J Cell Biol. 1997;136:1363–1373. - PMC - PubMed
    1. Kanwar OKYS, Yang Q, Wada J, Kashihara N, Tian Y, Wallner EI. Role of membrane-type matrix metalloproteinase 1 (MT-1-MMP), MMP-2, and its inhibitor in nephrogenesis. Am J Physiol. 1999;277:934–947. - PubMed

Publication types

Substances