

Dendritic cells infected by recombinant rabies virus vaccine vector expressing HIV-1 Gag are immunogenic even in the presence of vector-specific immunity
- PMID: 20728525
- PMCID: PMC2997164
- DOI: 10.1016/j.vaccine.2010.08.042
Dendritic cells infected by recombinant rabies virus vaccine vector expressing HIV-1 Gag are immunogenic even in the presence of vector-specific immunity
Abstract
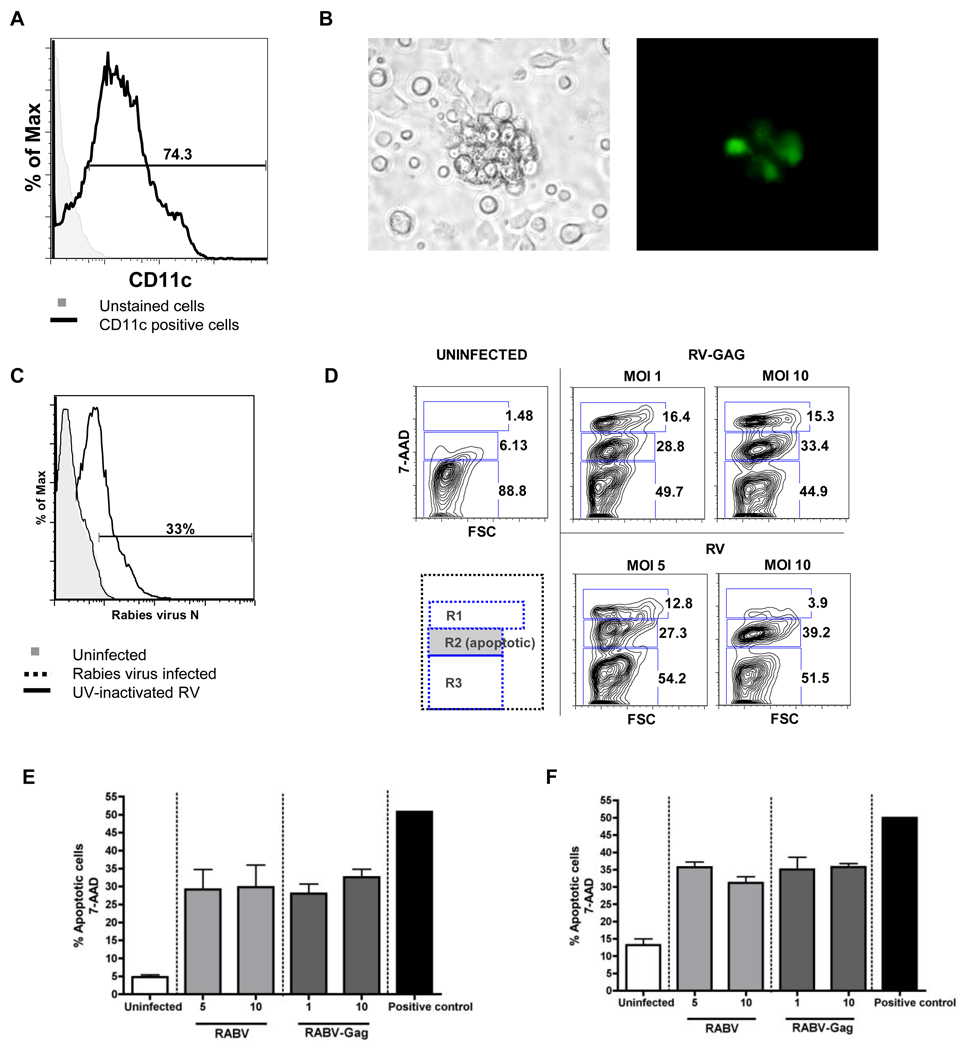
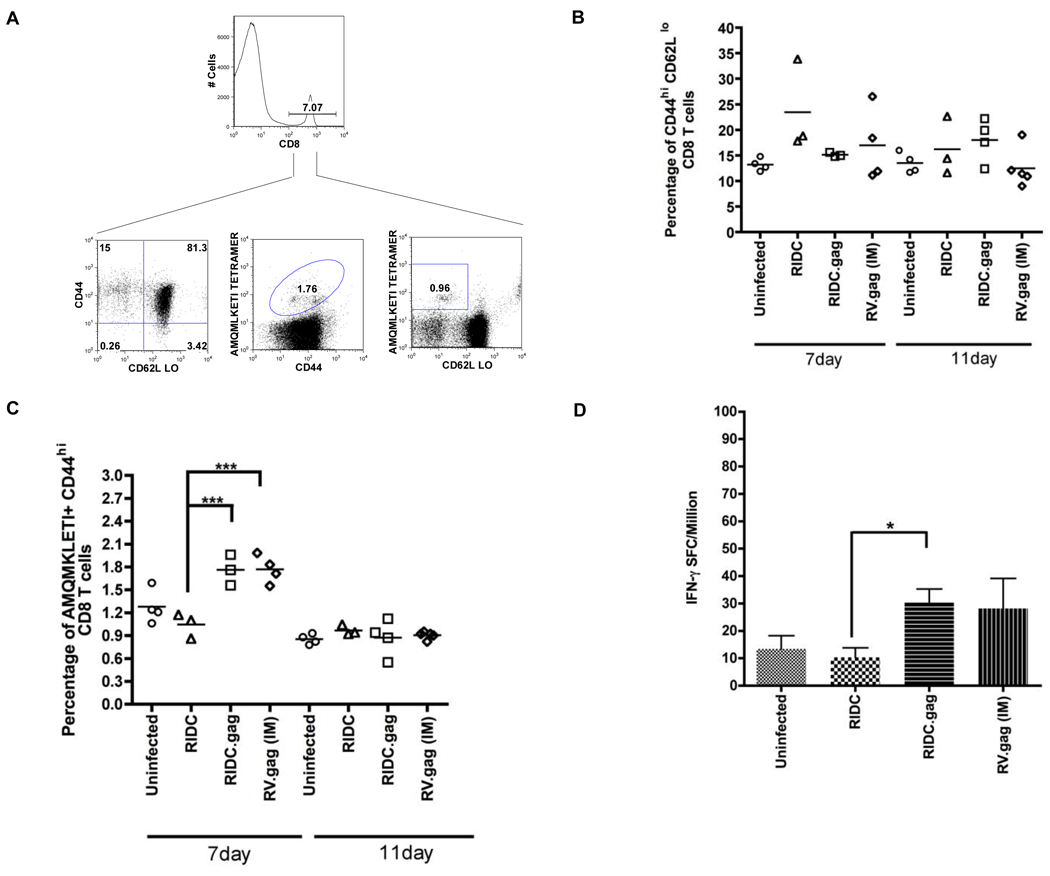
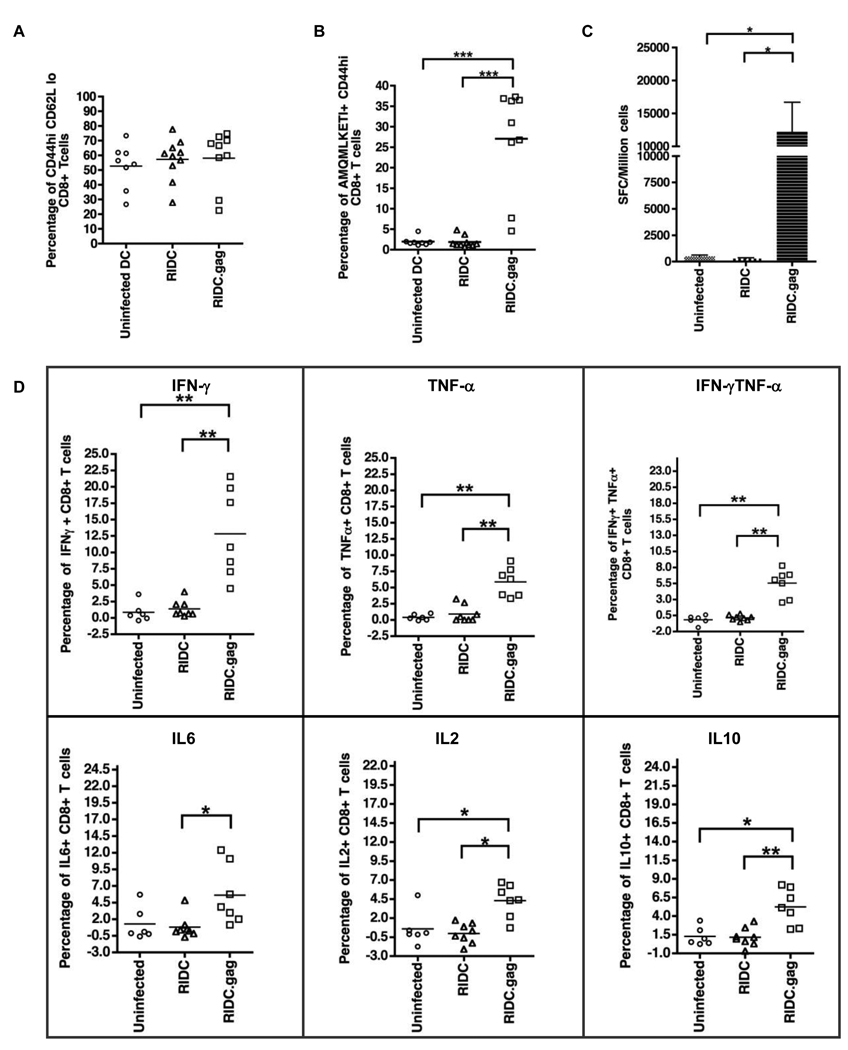
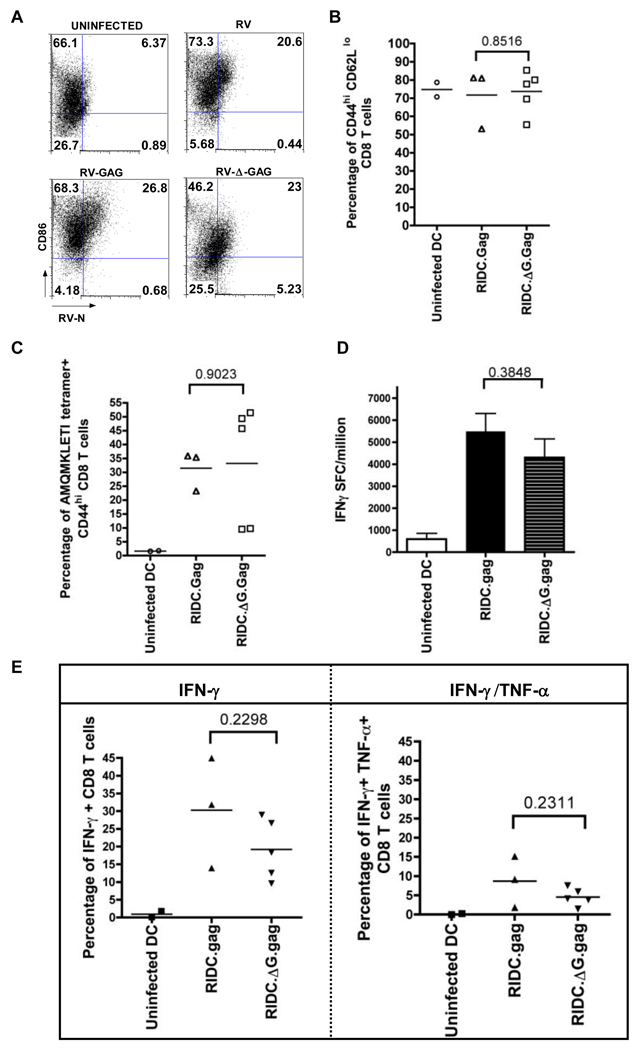
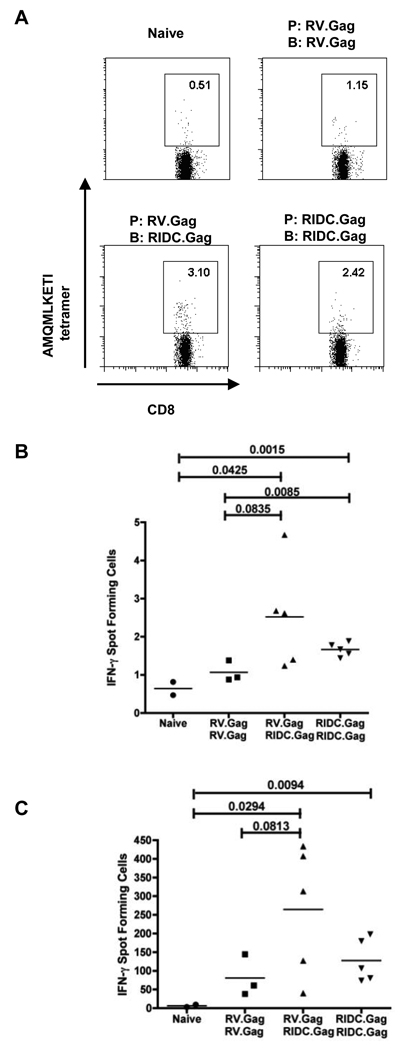
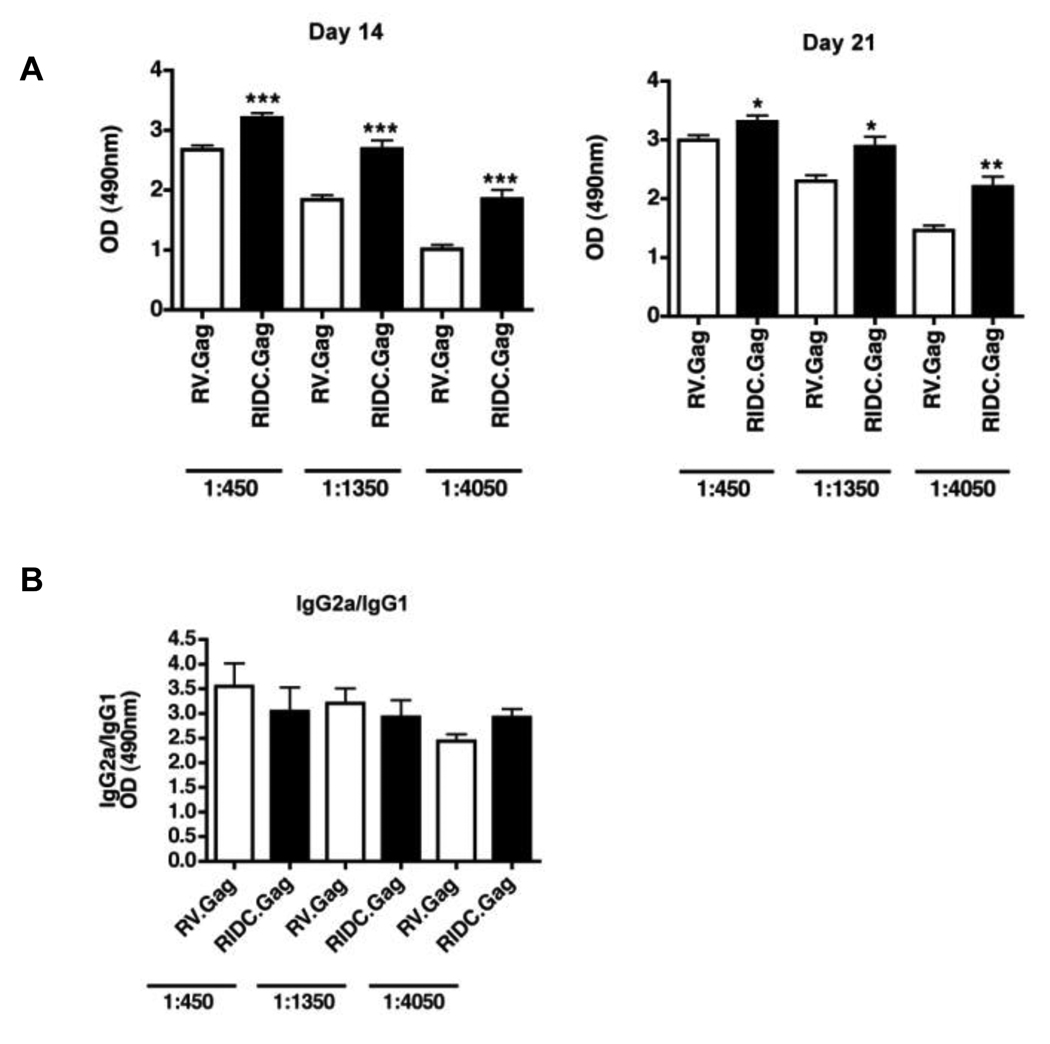
Dendritic cells (DC) are the most potent antigen presenting cells whose ability to interact with T cells, B cells and NK cells has led to their extensive use in vaccine design. Here, we designed a DC-based HIV-1 vaccine using an attenuated rabies virus vector expressing HIV-1 Gag (RIDC-Gag). To test this, BALB/c mice were immunized with RIDC-Gag, and the primary, secondary as well as humoral immune responses were monitored. Our results indicate that RIDC-Gag stimulated HIV-1 Gag-specific immune responses in mice. When challenged with vaccinia virus (VV) expressing HIV-1 Gag, they elicited a potent Gag-specific recall response characterized by CD8+ T cells expressing multiple cytokines that were capable of specifically lysing Gag-pulsed target cells. Moreover, RIDC-Gag also enhanced CD8+ T cell responses via a homologous prime-boost regimen. These results show that a DC-based vaccine using live RV is immunogenic and a potential candidate for a therapeutic HIV-1 vaccine.
Copyright © 2010 Elsevier Ltd. All rights reserved.
Figures


Similar articles
-
Comparison of Heterologous Prime-Boost Strategies against Human Immunodeficiency Virus Type 1 Gag Using Negative Stranded RNA Viruses.PLoS One. 2013 Jun 26;8(6):e67123. doi: 10.1371/journal.pone.0067123. Print 2013. PLoS One. 2013. PMID: 23840600 Free PMC article.
-
Virological and immunological characterization of novel NYVAC-based HIV/AIDS vaccine candidates expressing clade C trimeric soluble gp140(ZM96) and Gag(ZM96)-Pol-Nef(CN54) as virus-like particles.J Virol. 2015 Jan 15;89(2):970-88. doi: 10.1128/JVI.02469-14. Epub 2014 Oct 29. J Virol. 2015. PMID: 25355891 Free PMC article.
-
HIV-1 Gag-specific immunity induced by a lentivector-based vaccine directed to dendritic cells.Proc Natl Acad Sci U S A. 2009 Dec 1;106(48):20382-7. doi: 10.1073/pnas.0911742106. Epub 2009 Nov 16. Proc Natl Acad Sci U S A. 2009. PMID: 19918062 Free PMC article.
-
Live virus vaccines based on a vesicular stomatitis virus (VSV) backbone: Standardized template with key considerations for a risk/benefit assessment.Vaccine. 2016 Dec 12;34(51):6597-6609. doi: 10.1016/j.vaccine.2016.06.071. Epub 2016 Jul 6. Vaccine. 2016. PMID: 27395563 Free PMC article. Review.
-
HIV-derived vectors for gene therapy targeting dendritic cells.Adv Exp Med Biol. 2013;762:239-61. doi: 10.1007/978-1-4614-4433-6_9. Adv Exp Med Biol. 2013. PMID: 22975878 Review.
Cited by
-
Comparison of Heterologous Prime-Boost Strategies against Human Immunodeficiency Virus Type 1 Gag Using Negative Stranded RNA Viruses.PLoS One. 2013 Jun 26;8(6):e67123. doi: 10.1371/journal.pone.0067123. Print 2013. PLoS One. 2013. PMID: 23840600 Free PMC article.
-
B cell infection and activation by rabies virus-based vaccines.J Virol. 2013 Aug;87(16):9097-110. doi: 10.1128/JVI.00800-13. Epub 2013 Jun 12. J Virol. 2013. PMID: 23760241 Free PMC article.
-
Rabies virus is recognized by the NLRP3 inflammasome and activates interleukin-1β release in murine dendritic cells.J Virol. 2013 May;87(10):5848-57. doi: 10.1128/JVI.00203-13. Epub 2013 Mar 13. J Virol. 2013. PMID: 23487464 Free PMC article.
-
A role for granulocyte-macrophage colony-stimulating factor in the regulation of CD8(+) T cell responses to rabies virus.Virology. 2012 May 10;426(2):120-33. doi: 10.1016/j.virol.2012.01.025. Epub 2012 Feb 16. Virology. 2012. PMID: 22341782 Free PMC article.
-
Toll-Like Receptor 4 Regulates Rabies Virus-Induced Humoral Immunity through Recruitment of Conventional Type 2 Dendritic Cells to Lymph Organs.J Virol. 2021 Nov 23;95(24):e0082921. doi: 10.1128/JVI.00829-21. Epub 2021 Oct 6. J Virol. 2021. PMID: 34613801 Free PMC article.
References
-
- UNAIDS. 2008 Report on the Global AIDS Epidemic. 2008
-
- Monath TP. Yellow fever vaccine. Expert Rev Vaccines. 2005 Aug;4(4):553–574. - PubMed
-
- Ogra PL. Poliomyelitis as a paradigm for investment in and success of vaccination programs. Pediatr Infect Dis J. 1999 Jan;18(1):10–15. - PubMed
-
- Barron MA, Blyveis N, Palmer BE, MaWhinney S, Wilson CC. Influence of plasma viremia on defects in number and immunophenotype of blood dendritic cell subsets in human immunodeficiency virus 1-infected individuals. J Infect Dis. 2003 Jan 1;187(1):26–37. - PubMed
-
- Pacanowski J, Kahi S, Baillet M, Lebon P, Deveau C, Goujard C, et al. Reduced blood CD123+ (lymphoid) and CD11c+ (myeloid) dendritic cell numbers in primary HIV-1 infection. Blood. 2001 Nov 15;98(10):3016–3021. - PubMed
Publication types
MeSH terms
Substances
Grants and funding
LinkOut - more resources
Full Text Sources
Research Materials
