

Network analysis detects changes in the contralesional hemisphere following stroke
- PMID: 20728543
- PMCID: PMC3677803
- DOI: 10.1016/j.neuroimage.2010.08.032
Network analysis detects changes in the contralesional hemisphere following stroke
Abstract
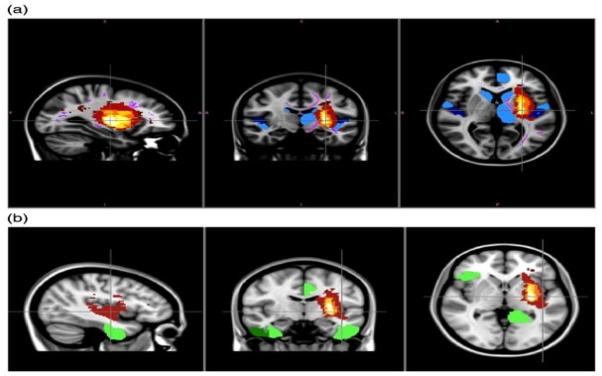
Changes in brain structure occur in remote regions following focal damage such as stroke. Such changes could disrupt processing of information across widely distributed brain networks. We used diffusion MRI tractography to assess connectivity between brain regions in 9 chronic stroke patients and 18 age-matched controls. We applied complex network analysis to calculate 'communicability', a measure of the ease with which information can travel across a network. Clustering individuals based on communicability separated patient and control groups, not only in the lesioned hemisphere but also in the contralesional hemisphere, despite the absence of gross structural pathology in the latter. In our highly selected patient group, lesions were localised to the left basal ganglia/internal capsule. We found reduced communicability in patients in regions surrounding the lesions in the affected hemisphere. In addition, communicability was reduced in homologous locations in the contralesional hemisphere for a subset of these regions. We interpret this as evidence for secondary degeneration of fibre pathways which occurs in remote regions interconnected, directly or indirectly, with the area of primary damage. We also identified regions with increased communicability in patients that could represent adaptive, plastic changes post-stroke. Network analysis provides new and powerful tools for understanding subtle changes in interactions across widely distributed brain networks following stroke.
Copyright © 2010 Elsevier Inc. All rights reserved.
Figures
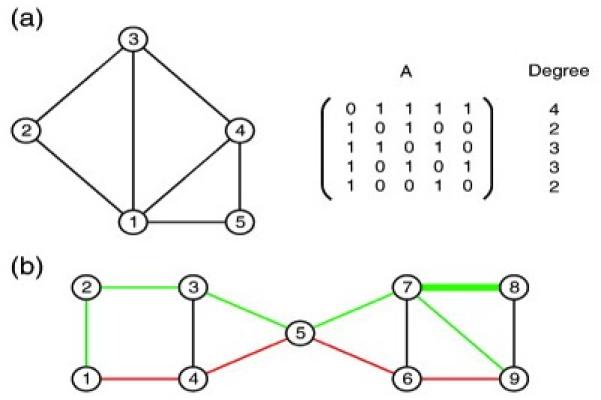
 4
4  5
5  6
6  9 (red), of length 4, gives the shortest walk between the two nodes. Whereas the second, longer walk 1
  2
2  3
3  5
5  7
7  8
8  7
7  9 (green) illustrates the fact that a walk may use the same link more thanonce; here the edge connecting nodes 7 and 8 is used twice in succession en route to node 9
Similar articles
-
Modified structural network backbone in the contralesional hemisphere chronically after stroke in rat brain.J Cereb Blood Flow Metab. 2018 Sep;38(9):1642-1653. doi: 10.1177/0271678X17713901. Epub 2017 Jun 12. J Cereb Blood Flow Metab. 2018. PMID: 28604153 Free PMC article.
-
Large-scale changes in network interactions as a physiological signature of spatial neglect.Brain. 2014 Dec;137(Pt 12):3267-83. doi: 10.1093/brain/awu297. Epub 2014 Nov 2. Brain. 2014. PMID: 25367028 Free PMC article.
-
Multimodal imaging of brain reorganization in motor areas of the contralesional hemisphere of well recovered patients after capsular stroke.Brain. 2006 Mar;129(Pt 3):791-808. doi: 10.1093/brain/awh713. Epub 2005 Dec 19. Brain. 2006. PMID: 16364955
-
Why use a connectivity-based approach to study stroke and recovery of function?Neuroimage. 2012 Oct 1;62(4):2271-80. doi: 10.1016/j.neuroimage.2012.02.070. Epub 2012 Mar 5. Neuroimage. 2012. PMID: 22414990 Free PMC article. Review.
-
Neuroimaging in cerebrovascular disorders: measurement of cerebral physiology after stroke and assessment of stroke recovery.Semin Nucl Med. 2003 Jan;33(1):56-76. doi: 10.1053/snuc.2003.127293. Semin Nucl Med. 2003. PMID: 12605357 Review.
Cited by
-
The distinct disrupted plasticity in structural and functional network in mild stroke with basal ganglia region infarcts.Brain Imaging Behav. 2022 Oct;16(5):2199-2219. doi: 10.1007/s11682-022-00689-8. Epub 2022 Jun 4. Brain Imaging Behav. 2022. PMID: 35665464
-
Individual-Level Lesion-Network Mapping to Visualize the Effects of a Stroke Lesion on the Brain Network: Connectograms in Stroke Syndromes.J Clin Neurol. 2020 Jan;16(1):116-123. doi: 10.3988/jcn.2020.16.1.116. J Clin Neurol. 2020. PMID: 31942767 Free PMC article.
-
Altered Brain Structural Networks in Patients with Brain Arteriovenous Malformations Located in Broca's Area.Neural Plast. 2020 Oct 24;2020:8886803. doi: 10.1155/2020/8886803. eCollection 2020. Neural Plast. 2020. PMID: 33163073 Free PMC article.
-
Baseline Motor Impairment Predicts Transcranial Direct Current Stimulation Combined with Physical Therapy-Induced Improvement in Individuals with Chronic Stroke.Neural Plast. 2020 Nov 25;2020:8859394. doi: 10.1155/2020/8859394. eCollection 2020. Neural Plast. 2020. PMID: 33299400 Free PMC article. Clinical Trial.
-
Altered Cortical Activity during a Finger Tap in People with Stroke.Brain Topogr. 2024 Sep;37(5):907-920. doi: 10.1007/s10548-024-01049-z. Epub 2024 May 9. Brain Topogr. 2024. PMID: 38722465
References
-
- Andrews RJ. Transhemispheric diachisis. A review and comment. Stroke. 1991;22(7):943–949. - PubMed
-
- Barabasi AL. Scale-free networks: a decade and beyond. Science. 2009;325(5939):412–413. - PubMed
-
- Beaulieu C. The basis of anisotropic water diffusion in the nervous system - a technical review. NMR Biomed. 2002;15(7–8):435–455. - PubMed
Publication types
MeSH terms
Grants and funding
LinkOut - more resources
Full Text Sources
Other Literature Sources
Medical
