. 2010 Nov 12;285(46):35267-73.
doi: 10.1074/jbc.M110.161208. Epub 2010 Aug 20.

Rad9 is required for B cell proliferation and immunoglobulin class switch recombination

Affiliations

Rad9 is required for B cell proliferation and immunoglobulin class switch recombination

Lili An et al. J Biol Chem. .

Abstract

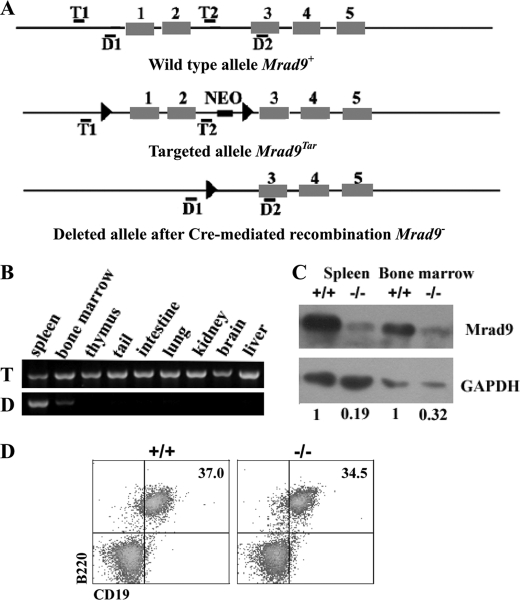
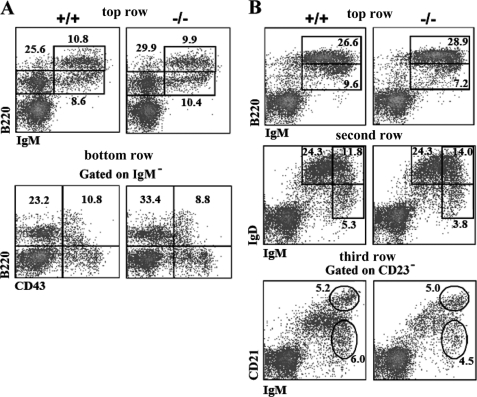
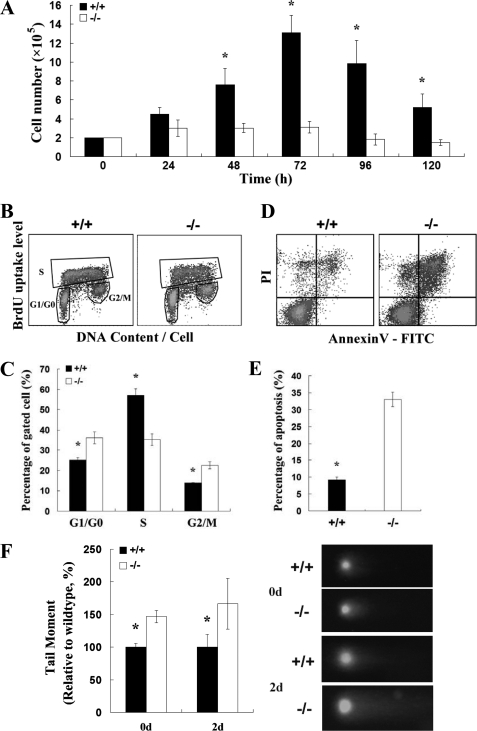
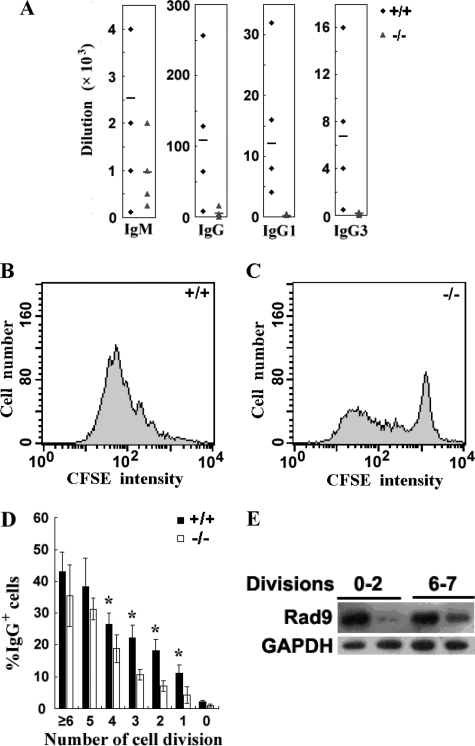
B cell maturation and B cell-mediated antibody response require programmed DNA modifications such as the V(D)J recombination, the immunoglobulin (Ig) class switch recombination, and the somatic hypermutation to generate functional Igs. Many protein factors involved in DNA damage repair have been shown to be critical for the maturation and activation of B cells. Rad9 plays an important role in both DNA repair and cell cycle checkpoint control. However, its role in Ig generation has not been reported. In this study, we generated a conditional knock-out mouse line in which Rad9 is deleted specifically in B cells and investigated the function of Rad9 in B cells. The Rad9(-/-) B cells isolated from the conditional knock-out mice displayed impaired growth response and enhanced DNA lesions. Impaired Ig production in response to immunization in Rad9(-/-) mice was also detected. In addition, the Ig class switch recombination is deficient in Rad9(-/-) B cells. Taken together, Rad9 plays dual roles in generating functional antibodies and in maintaining the integrity of the whole genome in B cells.


Figures

FIGURE 1.
FIGURE 1.
Rad9 deletion in B cells. A, maps of original, targeted, and deleted Rad9 genomic DNA fragments. Black boxes represent exons, and thin lines represent introns as well as DNA sequences surrounding Rad9 gene. Locations of primer pairs for detecting the targeting (T1/T2) and deletion (D1/D2) of the first two exons are marked. B, PCR genotyping of Rad9 deletion in mouse tissues. The deleted signature DNA band was only observed in spleen and bone marrow. T and D on the left of PCR panels indicate targeted and deleted signature bands of Rad9, respectively. C, Western blotting analyses for Rad9 protein levels in B cells purified from spleen and bone marrow. Numbers reflect the intensity of bands representing Rad9 protein levels normalized to GAPDH in Rad9−/− and Rad9+/+ B cells. D, flow cytometric analysis of CD19 expression. Cells isolated from the spleen of 6–8-week-old mice were stained with the antibodies indicated in the figure. Numbers show relative percentages of cells within the indicated gates. These analyses are averages of three pairs of Rad9+/+ and Rad9−/− mice. +/+ and −/− represent Rad9+/+ and Rad9−/− genotypes, respectively.
FIGURE 2.
FIGURE 2.
Flow cytometric analysis of lymphoid cell development of Rad9+/+ and Rad9−/− mice. Cells isolated from the bone marrow (A) and spleen (B) of 6–8-week-old mice were stained with the antibodies indicated in each figure. Numbers show relative percentages of cells within indicated gates. These analyses are averages of three pairs of Rad9+/+ and Rad9−/− mice. A, in the bone marrow (BM), top row, staining for pro/pre-B (IgMB220+), immature (IgM+B220lo), and mature recirculating (IgM+B220hi) B cells; bottom row, staining for pro-B cells (IgMB220+CD43+) and pre-B cells (IgMB220+CD43). B, in the spleen, top row, staining for immature (IgM+B220lo) and mature (IgM+B220hi) B cells; second row, staining for follicular B cells (IgMloIgDhi), transitional type-2 B cells (IgMhiIgDhi), and marginal zone/transitional type-1 B cells (IgMhiIgDlo); third row, staining for transitional type-1 B cells (CD23IgMhiCD21lo) and marginal zone B cells (CD23IgMhiCD21hi).
FIGURE 3.
FIGURE 3.
Rad9-dependent B cell expansion, apoptosis, and genomic integrity in response to LPS plus IL-4 in vitro. A, kinetics of the responses of Rad9+/+ and Rad9−/− B cells to LPS and IL-4 are similar with the peak at 72 h after stimulation. Cell proliferation was analyzed by counting trypan blue-excluded viable cells at the indicated times. The results are averages of three experiments. B, flow cytometric analysis of B cells stained with both PI and BrdU after 2 days of incubation. BrdU-positive S phase cells, BrdU-negative G1/G0 phase cells, and BrdU-negative G2/M phase cells were gated. C, quantitative comparison of cell cycle distribution between Rad9+/+ and Rad9−/− B cells. Three measurements as shown in B were carried out for comparison. D, flow cytometric analysis of B cells to assess spontaneous apoptosis using annexin V labeling. The B cells stimulated with IL-4 and LPS were incubated for 2 days before harvesting for apoptotic analysis. E, quantitative comparison of apoptosis between Rad9+/+ and Rad9−/− B cells. Three apoptotic assays shown in D were carried out for comparison. F, evaluation of DNA double strand breaks in resting B cells (day 0) and in B cells after 2 days of incubation by the neutral comet assay. On the right, representative comet assay results were shown, and on the left, quantitative comparison of comet tail moments between 100 Rad9−/− B cells and 100 Rad9+/+ B cells are shown. Student's t test, *, p < 0.05. Error bars represent the mean ± S.E.
FIGURE 4.
FIGURE 4.
Impaired humoral immune response of Rad9−/− mice and defective CSR in Rad9−/− B cells. A, serum TNP-specific Ig levels in Rad9+/+ and Rad9−/− mice at 14 days after immunization with TNP-KLH were determined by ELISA. Data are plotted as the dilution in six mice of each genotype. Diamonds represent the values derived from Rad9+/+, and triangles represent the values derived from Rad9−/− mice. The bar denotes the mean of each group. B and C, cell divisions shown by CFSE dye dilution of Rad9+/+ and Rad9−/− B cells stimulated with LPS and IL-4 for 4 days were analyzed by flow cytometry. D, flow cytometric analysis of surface IgG expression by CFSE-labeled Rad9+/+ and Rad9−/− B cells after 4 days of LPS and IL-4 stimulation. The percentage of cells expressing IgG is calculated from and shown separately for each population that has undergone the indicated number of cell divisions. The data represent the mean ± S.E. of four cell cultures. E, Western blotting analyses for Rad9 protein levels in B cells with different cell divisions. We collected B cells that had completed 0–2 cell divisions and six cell divisions as well as more than 6 cell divisions by cell sorting and measured Rad9 protein levels by Western blotting. The cells that survived six cell divisions or more than six cell divisions expressed higher levels of Rad9 protein than the cells that survived 0–2 cell divisions. Student's t test, *, p < 0.05.

References

    1. Revy P., Buck D., le Deist F., de Villartay J. P. (2005) Adv. Immunol. 87, 237–295 - PubMed
    1. Branzei D., Foiani M. (2005) Curr. Opin. Cell. Biol. 17, 568–575 - PubMed
    1. Xu Y. (2006) Nat. Rev. Immunol. 6, 261–270 - PubMed
    1. Peled J. U., Kuang F. L., Iglesias-Ussel M. D., Roa S., Kalis S. L., Goodman M. F., Scharff M. D. (2008) Annu. Rev. Immunol. 26, 481–511 - PubMed
    1. Sancar A., Lindsey-Boltz L. A., Unsal-Kaçmaz K., Linn S. (2004) Annu. Rev. Biochem. 73, 39–85 - PubMed

Publication types

MeSH terms