. 2010 Oct;76(20):6787-96.
doi: 10.1128/AEM.01098-10. Epub 2010 Aug 20.

Transmission of plant-pathogenic bacteria by nonhost seeds without induction of an associated defense reaction at emergence

Affiliations

Transmission of plant-pathogenic bacteria by nonhost seeds without induction of an associated defense reaction at emergence

Armelle Darrasse et al. Appl Environ Microbiol. 2010 Oct.

Abstract

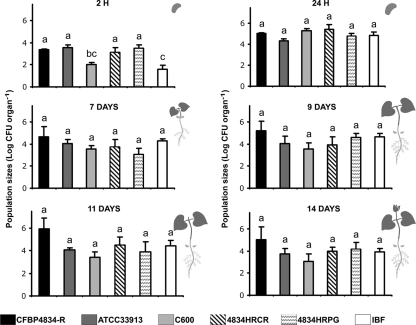
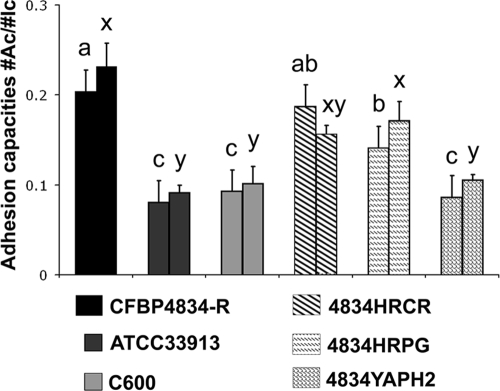
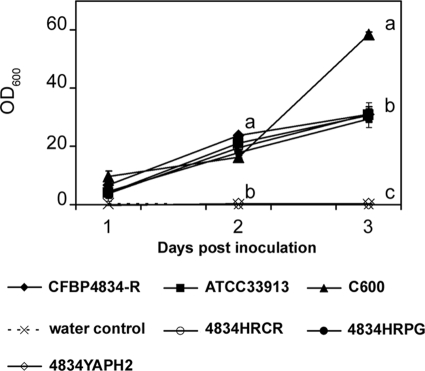
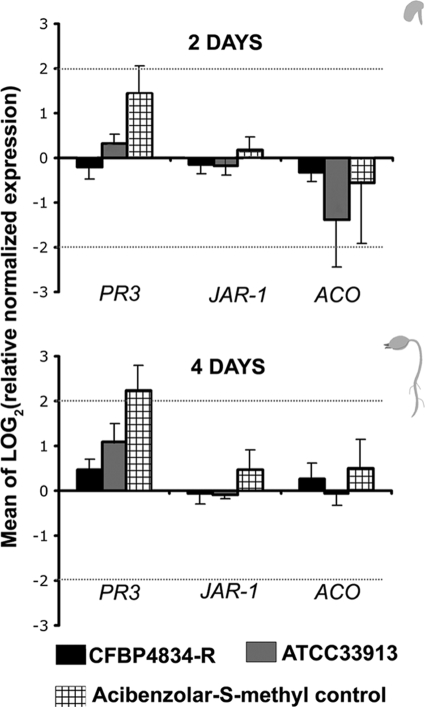
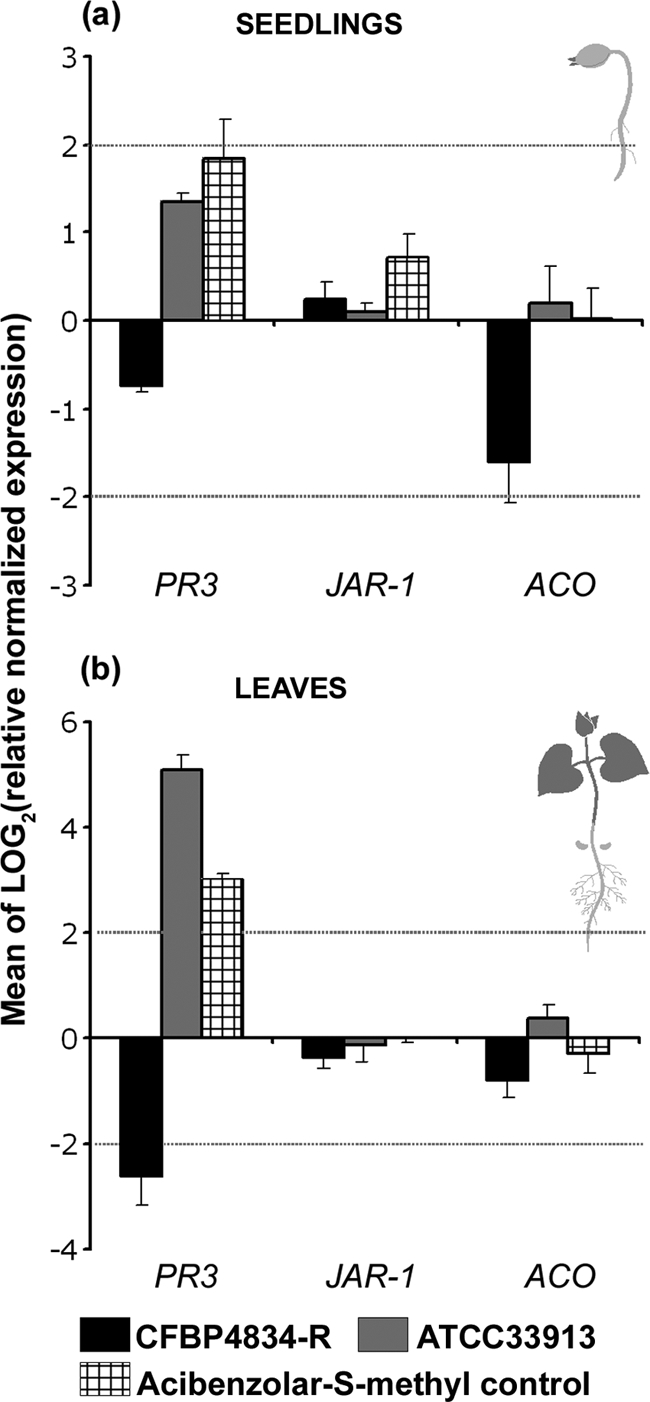
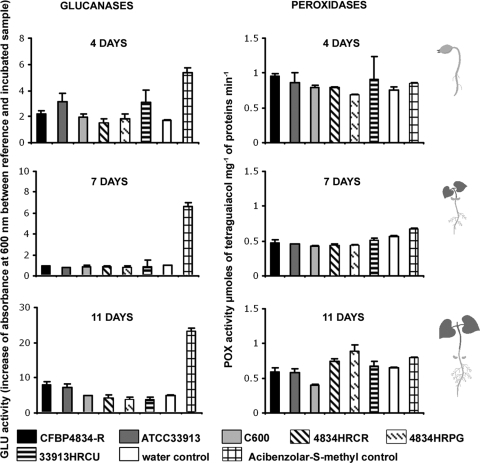
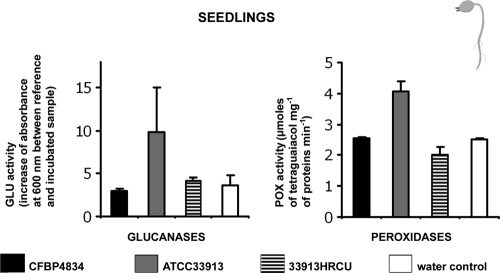
An understanding of the mechanisms involved in the different steps of bacterial disease epidemiology is essential to develop new control strategies. Seeds are the passive carriers of a diversified microbial cohort likely to affect seedling physiology. Among seed-borne plant-pathogenic bacteria, seed carriage in compatible situations is well evidenced. The aims of our work are to determine the efficiency of pathogen transmission to seeds of a nonhost plant and to evaluate bacterial and plant behaviors at emergence. Bacterial transmission from flowers to seeds and from seeds to seedlings was measured for Xanthomonas campestris pv. campestris in incompatible interactions with bean. Transmissions from seeds to seedlings were compared for X. campestris pv. campestris, for Xanthomonas citri pv. phaseoli var. fuscans in compatible interactions with bean, and for Escherichia coli, a human pathogen, in null interactions with bean. The induction of defense responses was monitored by using reverse transcription and quantitative PCR (RT-qPCR) of genes representing the main signaling pathways and assaying defense-related enzymatic activities. Flower inoculations resulted in a high level of bean seed contamination by X. campestris pv. campestris, which transmitted efficiently to seedlings. Whatever the type of interaction tested, dynamics of bacterial population sizes were similar on seedlings, and no defense responses were induced evidencing bacterial colonization of seedlings without any associated defense response induction. Bacteria associated with the spermosphere multiply in this rich environment, suggesting that the colonization of seedlings relies mostly on commensalism. The transmission of plant-pathogenic bacteria to and by nonhost seeds suggests a probable role of seeds of nonhost plants as an inoculum source.


Figures

FIG. 1.
FIG. 1.
Colonization of bean seedlings by X. citri pv. phaseoli var. fuscans wild-type strain CFBP4834-R and mutant strains 4834HRCR and 4834HRPG, X. campestris pv. campestris ATCC 33913, and E. coli C600. Bacterial population sizes were quantified on bean seeds 2 h and 24 h after vacuum infiltration (1 × 10⁶ CFU ml−1) of seeds and on primary leaves at 7, 9, 11, and 14 days. The physiological stage of the plant at each sampling time is illustrated on the right of the graphs. Population sizes of indigenous bacterial flora (IBF) were quantified at each sampling date. Means and SEM were calculated for data from four independent experiments with five individuals per sampling date and per treatment. Mean population sizes followed by different letters are significantly (P < 0.05) different on the basis of a Mann-Whitney U test.
FIG. 2.
FIG. 2.
Adhesion capacities of bacterial strains on bean seeds. X. citri pv. phaseoli var. fuscans strains CFBP4834-R, 4834HRCR, 4834HRPG, and 4834YAPH2; X. campestris pv. campestris ATCC 33913; and E. coli C600 suspensions at 1 × 10⁵ CFU ml−1 were incubated during 2 h with bean seeds. Bars represent the ratios of numbers of attached cells on seeds (#Ac) versus inoculated cells (#Ic). Means and SEM were calculated for three samples per treatment and per experiment. For each treatment double bars stand for data from two independent experiments. Within an experiment, mean population sizes followed by different letters are significantly different (P < 0.05) on the basis of a Mann-Whitney U test.
FIG. 3.
FIG. 3.
Kinetics of the adhesion capacities of bacterial strains on a polypropylene surface. X. citri pv. phaseoli var. fuscans strains CFBP4834, 4834HRCR, 4834HRPG, and 4834YAPH2; X. campestris pv. campestris ATCC 33913; and E. coli C600 were cultured during 3 days at 28°C under static conditions in polypropylene microtiter plates from an inoculum at 5 × 10⁵ CFU ml−1. Crystal violet-stained surface-attached cells were quantified by solubilizing the dye absorbed by adherent cells, after the removal of suspensions, in ethanol and determining the optical density at 600 nm. Means and SEM were calculated for data from two independent experiments, each containing three replicates per treatment and per sampling date. For a given sampling date different letters refer to significantly (P < 0.05) different values based on a Mann-Whitney U test.
FIG. 4.
FIG. 4.
Relative normalized expressions of the PR-3, JAR-1, and ACO genes in seedlings following seed inoculation. Seeds were inoculated with 1 × 10⁶ CFU ml−1 of X. citri pv. phaseoli var. fuscans strain CFBP4834-R, X. campestris pv. campestris strain ATCC 33913, acibenzolar-S-methyl (Bion/WG 50; 400 mg liter−1) as a positive control, and water as negative control (calibrator). Dotted bars represent a 4-time [log2(4) = 2] induction or repression relative to the negative control. The mean of water treatment values was used for calibration at each sampling date, and the geometric mean of values obtained for internal controls (UBI and EF1-α) was used to normalize each sample. The physiological stage of plants at the sampling time is illustrated on the right of the graphs. Means and SEM were calculated for data from three independent experiments, each containing three independent samples of plant material per treatment and two replicates per sample.
FIG. 5.
FIG. 5.
Relative expressions of the PR-3, JAR-1, and ACO genes following infiltration of 2-day-old seedlings (a) and leaves (b). Plants were inoculated with 1 × 10⁶ CFU ml−1 of X. citri pv. phaseoli var. fuscans strain CFBP4834-R, X. campestris pv. campestris strain ATCC 33913, acibenzolar-S-methyl methyl (Bion/WG 50; 400 mg liter−1) as a positive control, and water as a negative control (calibrator). Dotted bars represent a 4-time [log2(4) = 2] induction or repression relative to the negative control. The mean of water treatment values was used for calibration at each sampling date, and the geometric mean of values obtained for internal controls (UBI and EF1-α) was used to normalize each sample. The physiological stage of plants at the sampling time is illustrated at the right of the graphs. Means and SEM were calculated for three independent samples of plant material per treatment and two replicates per sample.
FIG. 6.
FIG. 6.
β-1,3-Glucanase (GLU) and peroxidase (POX) activities in protein extracts from bean seedlings after seed infiltration (1 × 10⁶ CFU ml−1) with X. citri pv. phaseoli var. fuscans strains CFBP4834-R, 4834HRCR, and 4834HRPG; X. campestris pv. campestris strains ATCC 33913 and 33913HRCU; E. coli C600; acibenzolar-S-methyl (Bion/WG 50; 400 mg liter−1); and distilled water (control). The physiological stage of plants at the sampling time is illustrated at the right of the graphs. Means and SEM were calculated for two independent duplicated samples. Each sample was made of the bulk of three to eight seedlings (aerial part without cotyledons) or the bulk of primary leaf pieces from three plants.
FIG. 7.
FIG. 7.
β-1,3-Glucanase (GLU) and peroxidase (POX) activities in protein extracts from infiltrated bean seedlings. Enzymatic activities were assayed 2 days after the infiltration of 2-day-old bean seedlings with 1 × 10⁶ CFU ml−1 of X. citri pv. phaseoli var. fuscans strain CFBP4834-R, X. campestris pv. campestris strains ATCC 33913 and 33913HRCU, and water (negative control). Means and SEM were calculated for two independent duplicated samples. Each sample was made of the bulk of three seedlings (aerial part without cotyledons).

Similar articles

Cited by

References

    1. Ah-You, N., L. Gagnevin, P. A. D. Grimont, S. Brisse, X. Nesme, F. Chiroleu, L. B. T. Ngoc, E. Jouen, P. Lefeuvre, C. Vernière, and O. Pruvost. 2009. Polyphasic characterization of xanthomonads pathogenic to members of the Anacardiacae and their relatedness to the species of Xanthomonas. Int. J. Syst. Evol. Microbiol. 59:306-318. - PubMed
    1. Arlat, M., C. L. Gough, C. E. Barber, C. Boucher, and M. J. Daniels. 1991. Xanthomonas campestris contains a cluster of hrp genes related to the larger hrp cluster of Pseudomonas solanacearum. Mol. Plant Microbe Interact. 4:593-601. - PubMed
    1. Boureau, T., H. ElMaarouf-Bouteau, A. Garnier, M.-N. Brisset, C. Perino, I. Pucheu, and M.-A. Barny. 2006. DspA/E, a type III effector essential for Erwinia amylovora pathogenicity and growth in planta, induces cell death in host apple and non-host tobacco plants. Mol. Plant Microbe Interact. 19:16-24. - PubMed
    1. Bradford, M. M. 1976. A rapid and sensitive method for quantification of microgram quantities of protein utilizing the principle of protein-dye binding. Anal. Biochem. 72:248-254. - PubMed
    1. Brunings, A. M., and D. W. Gabriel. 2003. Xanthomonas citri: breaking the surface. Mol. Plant Pathol. 4:141-157. - PubMed

Publication types

MeSH terms

LinkOut - more resources