

Route of antigen uptake differentially impacts presentation by dendritic cells and activated monocytes
- PMID: 20729332
- PMCID: PMC3013633
- DOI: 10.4049/jimmunol.1001205
Route of antigen uptake differentially impacts presentation by dendritic cells and activated monocytes
Abstract
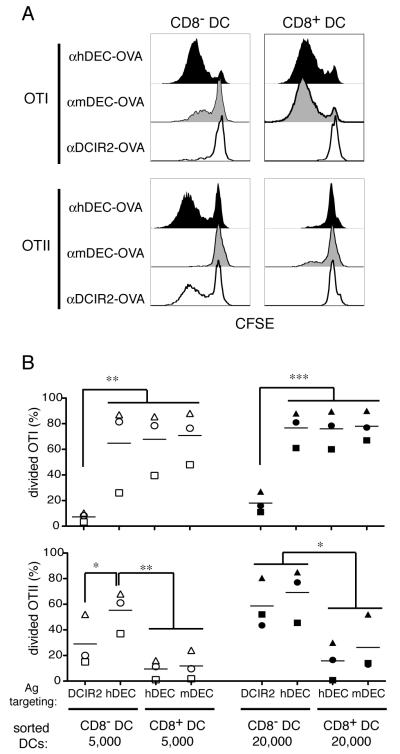
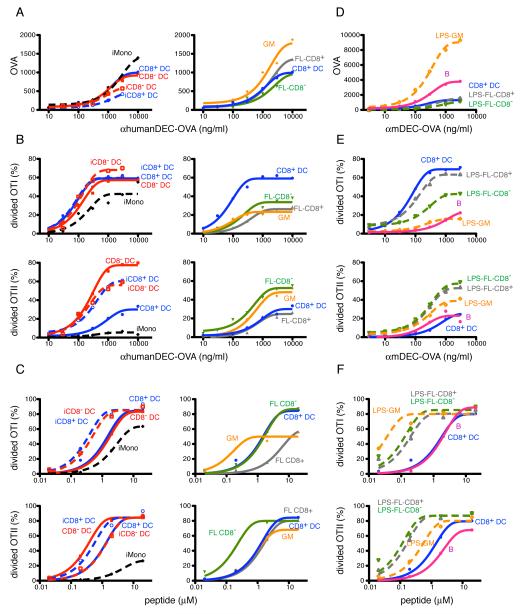
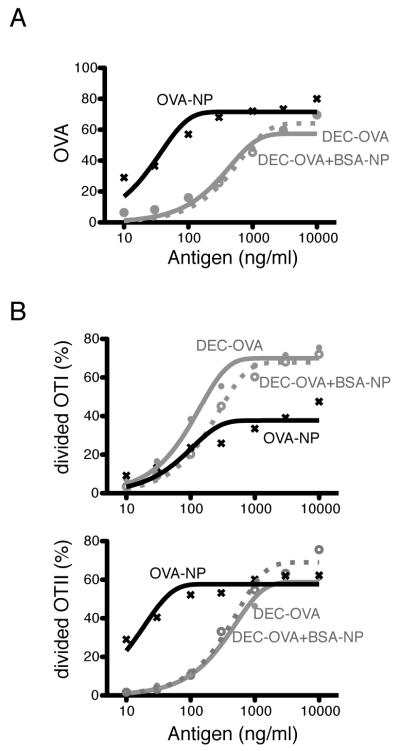
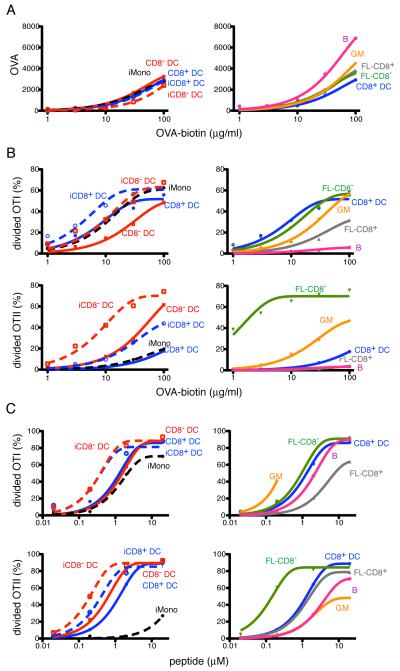
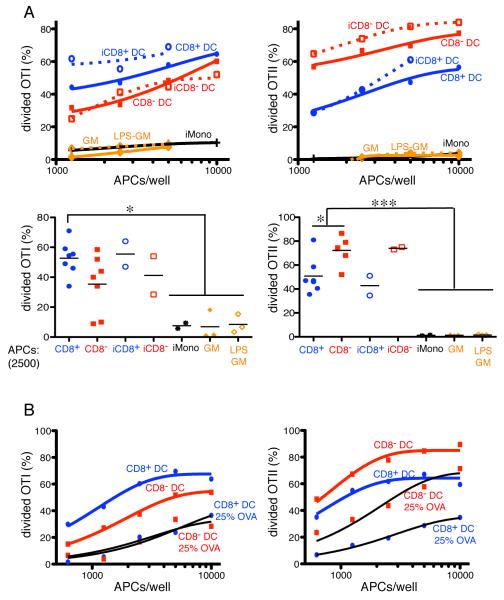
Dendritic cells (DCs), which maintain tolerance and orchestrate T cell immune responses, comprise a heterogeneous group of cells. For example, in the steady state, murine spleen contains pre-DC-derived CD8(+) and CD8(-) conventional DCs. During inflammation, monocytes become activated and acquire some DC-like features, such as expression of CD11c and MHC class II. Although each of these cell types can present Ag, the relative efficiency of processing and presentation after Ag capture by different routes has not yet been systematically compared. To this end, we administered OVA to various conventional DCs and activated monocytes by receptor-mediated endocytosis, pinocytosis, or phagocytosis and measured internalization and presentation to MHC class I- and MHC class II-restricted T cells. We find that CD8(-) DCs are more efficient than any other type of APC tested in terms of presenting Ag to MHC class II-restricted T cells, irrespective of the route of Ag capture. In contrast, both subsets of splenic DCs are highly effective in cross-presenting Ags to CD8(+) T cells. DCs and activated monocytes cross-presented Ags delivered by DEC205-mediated endocytosis and pinocytosis. However, DCs differ from activated monocytes in that the latter are several orders of magnitude less efficient in presenting Ags captured by phagocytosis to CD8(+) or CD4(+) T cells. We conclude that DCs derived from pre-DCs differ from monocyte-derived cells in that DCs process and present Ags efficiently irrespective of the route of Ag capture. Our observations have significant implications for understanding initiation of immune responses and vaccination strategies targeting DCs and activated monocytes.
Figures
Similar articles
-
Efficient targeting of protein antigen to the dendritic cell receptor DEC-205 in the steady state leads to antigen presentation on major histocompatibility complex class I products and peripheral CD8+ T cell tolerance.J Exp Med. 2002 Dec 16;196(12):1627-38. doi: 10.1084/jem.20021598. J Exp Med. 2002. PMID: 12486105 Free PMC article.
-
Criteria for dendritic cell receptor selection for efficient antibody-targeted vaccination.J Immunol. 2015 Mar 15;194(6):2696-705. doi: 10.4049/jimmunol.1402535. Epub 2015 Feb 4. J Immunol. 2015. PMID: 25653426
-
Selection of an antibody library identifies a pathway to induce immunity by targeting CD36 on steady-state CD8 alpha+ dendritic cells.J Immunol. 2008 Mar 1;180(5):3201-9. doi: 10.4049/jimmunol.180.5.3201. J Immunol. 2008. PMID: 18292544
-
Endocytic Recycling of MHC Class I Molecules in Non-professional Antigen Presenting and Dendritic Cells.Front Immunol. 2019 Jan 7;9:3098. doi: 10.3389/fimmu.2018.03098. eCollection 2018. Front Immunol. 2019. PMID: 30666258 Free PMC article. Review.
-
Lipid-Polymer Hybrid Nanoparticles Utilize B Cells and Dendritic Cells to Elicit Distinct Antigen-Specific CD4+ and CD8+ T Cell Responses.ACS Appl Bio Mater. 2024 Aug 19;7(8):4818-4830. doi: 10.1021/acsabm.3c00229. Epub 2023 May 23. ACS Appl Bio Mater. 2024. PMID: 37219857 Free PMC article. Review.
Cited by
-
Canvassing Prospects of Glyco-Nanovaccines for Developing Cross-Presentation Mediated Anti-Tumor Immunotherapy.Vaccines (Basel). 2022 Nov 30;10(12):2049. doi: 10.3390/vaccines10122049. Vaccines (Basel). 2022. PMID: 36560459 Free PMC article. Review.
-
Transcriptional regulation of dendritic cell development and function.Front Immunol. 2023 Jul 14;14:1182553. doi: 10.3389/fimmu.2023.1182553. eCollection 2023. Front Immunol. 2023. PMID: 37520521 Free PMC article. Review.
-
Pre-existing immunity and vaccine history determine hemagglutinin-specific CD4 T cell and IgG response following seasonal influenza vaccination.Nat Commun. 2021 Nov 18;12(1):6720. doi: 10.1038/s41467-021-27064-3. Nat Commun. 2021. PMID: 34795301 Free PMC article.
-
From vaccines to memory and back.Immunity. 2010 Oct 29;33(4):451-63. doi: 10.1016/j.immuni.2010.10.008. Immunity. 2010. PMID: 21029957 Free PMC article. Review.
-
Transcriptional Control of Dendritic Cell Development.Annu Rev Immunol. 2016 May 20;34:93-119. doi: 10.1146/annurev-immunol-032713-120204. Epub 2015 Dec 23. Annu Rev Immunol. 2016. PMID: 26735697 Free PMC article. Review.
References
Publication types
MeSH terms
Substances
Grants and funding
LinkOut - more resources
Full Text Sources
Molecular Biology Databases
Research Materials
