

Structural and functional divergence of a 1-Mb duplicated region in the soybean (Glycine max) genome and comparison to an orthologous region from Phaseolus vulgaris
- PMID: 20729383
- PMCID: PMC2947175
- DOI: 10.1105/tpc.110.074229
Structural and functional divergence of a 1-Mb duplicated region in the soybean (Glycine max) genome and comparison to an orthologous region from Phaseolus vulgaris
Abstract
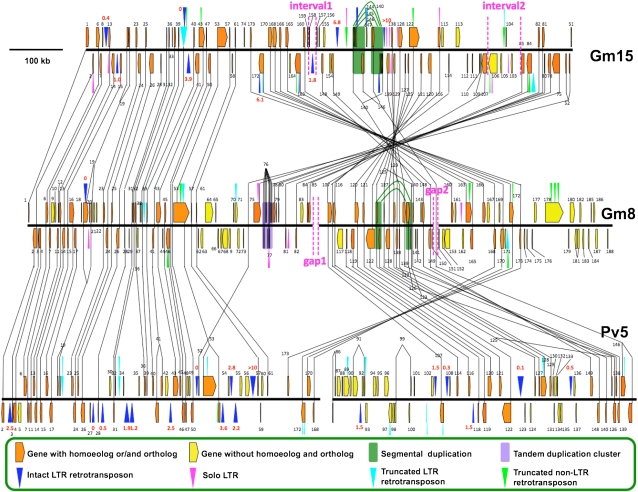
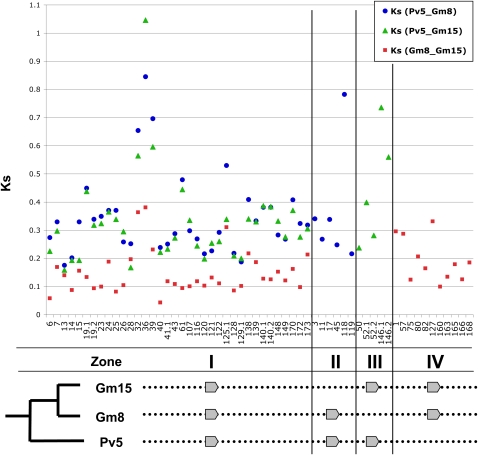
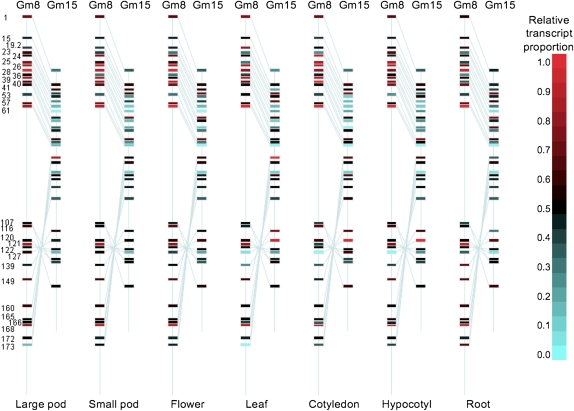
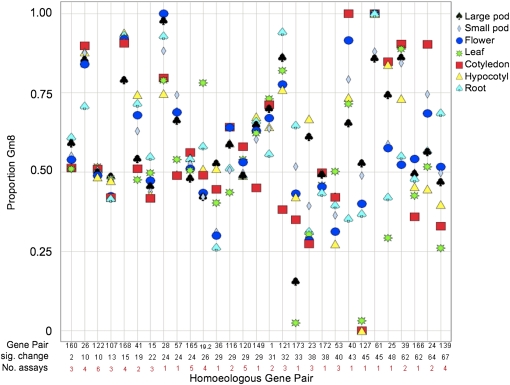
Soybean (Glycine max) has undergone at least two rounds of polyploidization, resulting in a paleopolyploid genome that is a mosaic of homoeologous regions. To determine the structural and functional impact of these duplications, we sequenced two ~1-Mb homoeologous regions of soybean, Gm8 and Gm15, derived from the most recent ~13 million year duplication event and the orthologous region from common bean (Phaseolus vulgaris), Pv5. We observed inversions leading to major structural variation and a bias between the two chromosome segments as Gm15 experienced more gene movement (gene retention rate of 81% in Gm15 versus 91% in Gm8) and a nearly twofold increase in the deletion of long terminal repeat (LTR) retrotransposons via solo LTR formation. Functional analyses of Gm15 and Gm8 revealed decreases in gene expression and synonymous substitution rates for Gm15, for instance, a 38% increase in transcript levels from Gm8 relative to Gm15. Transcriptional divergence of homoeologs was found based on expression patterns among seven tissues and developmental stages. Our results indicate asymmetric evolution between homoeologous regions of soybean as evidenced by structural changes and expression variances of homoeologous genes.
Figures
Similar articles
-
Differential accumulation of retroelements and diversification of NB-LRR disease resistance genes in duplicated regions following polyploidy in the ancestor of soybean.Plant Physiol. 2008 Dec;148(4):1740-59. doi: 10.1104/pp.108.127902. Epub 2008 Oct 8. Plant Physiol. 2008. PMID: 18842825 Free PMC article.
-
Replication of nonautonomous retroelements in soybean appears to be both recent and common.Plant Physiol. 2008 Dec;148(4):1760-71. doi: 10.1104/pp.108.127910. Epub 2008 Oct 24. Plant Physiol. 2008. PMID: 18952860 Free PMC article.
-
The lipoxygenase gene family: a genomic fossil of shared polyploidy between Glycine max and Medicago truncatula.BMC Plant Biol. 2008 Dec 23;8:133. doi: 10.1186/1471-2229-8-133. BMC Plant Biol. 2008. PMID: 19105811 Free PMC article.
-
Sequence level analysis of recently duplicated regions in soybean [Glycine max (L.) Merr.] genome.DNA Res. 2008 Apr 30;15(2):93-102. doi: 10.1093/dnares/dsn001. Epub 2008 Mar 11. DNA Res. 2008. PMID: 18334514 Free PMC article.
-
Identification and analysis of gene families from the duplicated genome of soybean using EST sequences.BMC Genomics. 2006 Aug 9;7:204. doi: 10.1186/1471-2164-7-204. BMC Genomics. 2006. PMID: 16899135 Free PMC article. Review.
Cited by
-
Genetic Diversity of Transcription Factor Genes in Triticum and Mining for Promising Haplotypes for Beneficial Agronomic Traits.Front Plant Sci. 2022 Jul 8;13:899292. doi: 10.3389/fpls.2022.899292. eCollection 2022. Front Plant Sci. 2022. PMID: 35873966 Free PMC article.
-
Systems and evolutionary characterization of microRNAs and their underlying regulatory networks in soybean cotyledons.PLoS One. 2014 Jan 27;9(1):e86153. doi: 10.1371/journal.pone.0086153. eCollection 2014. PLoS One. 2014. PMID: 24475082 Free PMC article.
-
Genome-wide annotation and characterization of CLAVATA/ESR (CLE) peptide hormones of soybean (Glycine max) and common bean (Phaseolus vulgaris), and their orthologues of Arabidopsis thaliana.J Exp Bot. 2015 Aug;66(17):5271-87. doi: 10.1093/jxb/erv351. Epub 2015 Jul 17. J Exp Bot. 2015. PMID: 26188205 Free PMC article.
-
Comparative analysis of syntenic genes in grass genomes reveals accelerated rates of gene structure and coding sequence evolution in polyploid wheat.Plant Physiol. 2013 Jan;161(1):252-65. doi: 10.1104/pp.112.205161. Epub 2012 Nov 1. Plant Physiol. 2013. PMID: 23124323 Free PMC article.
-
Common Bean Subtelomeres Are Hot Spots of Recombination and Favor Resistance Gene Evolution.Front Plant Sci. 2018 Aug 14;9:1185. doi: 10.3389/fpls.2018.01185. eCollection 2018. Front Plant Sci. 2018. PMID: 30154814 Free PMC article.
References
-
- Altschul S.F., Gish W., Miller W., Myers E.W., Lipman D.J. (1990). Basic local alignment search tool. J. Mol. Biol. 215: 403–410 - PubMed
-
- Arndt P.F., Hwa T., Petrov D.A. (2005). Substantial regional variation in substitution rates in the human genome: Importance of GC content, gene density, and telomere-specific effects. J. Mol. Evol. 60: 748–763 - PubMed
-
- Baer C.F., Miyamoto M.M., Denver D.R. (2007). Mutation rate variation in multicellular eukaryotes: Causes and consequences. Nat. Rev. Genet. 8: 619–631 - PubMed
-
- Benovoy D., Drouin G. (2006). Processed pseudogenes, processed genes, and spontaneous mutations in the Arabidopsis genome. J. Mol. Evol. 62: 511–522 - PubMed
Publication types
MeSH terms
Substances
LinkOut - more resources
Full Text Sources
Miscellaneous
