. 2010 Sep;7(9):761-8.
doi: 10.1038/nmeth.1493. Epub 2010 Aug 22.

Analysis of microtubule dynamic instability using a plus-end growth marker

Affiliations

Analysis of microtubule dynamic instability using a plus-end growth marker

Alexandre Matov et al. Nat Methods. 2010 Sep.

Abstract

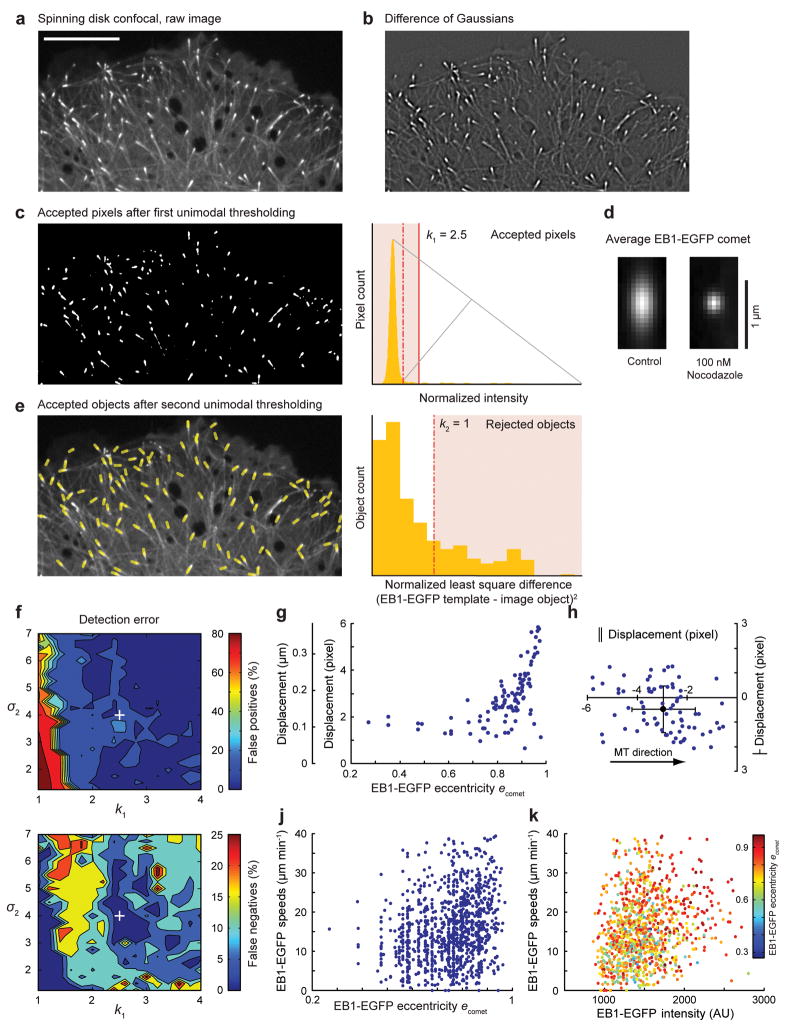
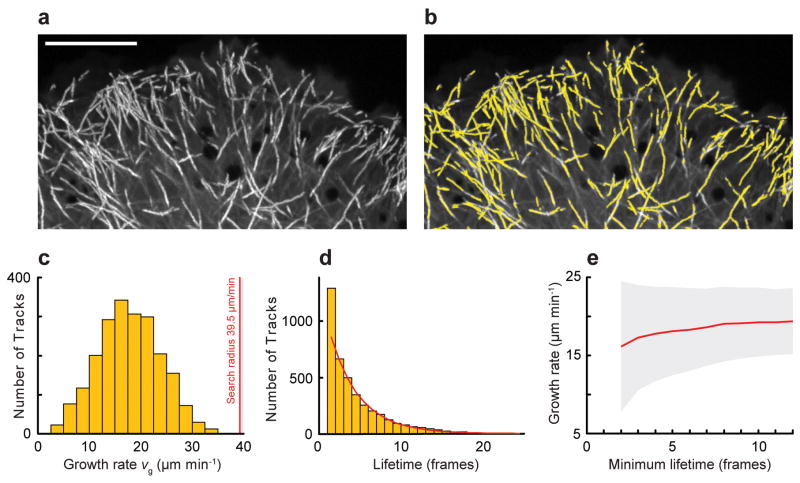
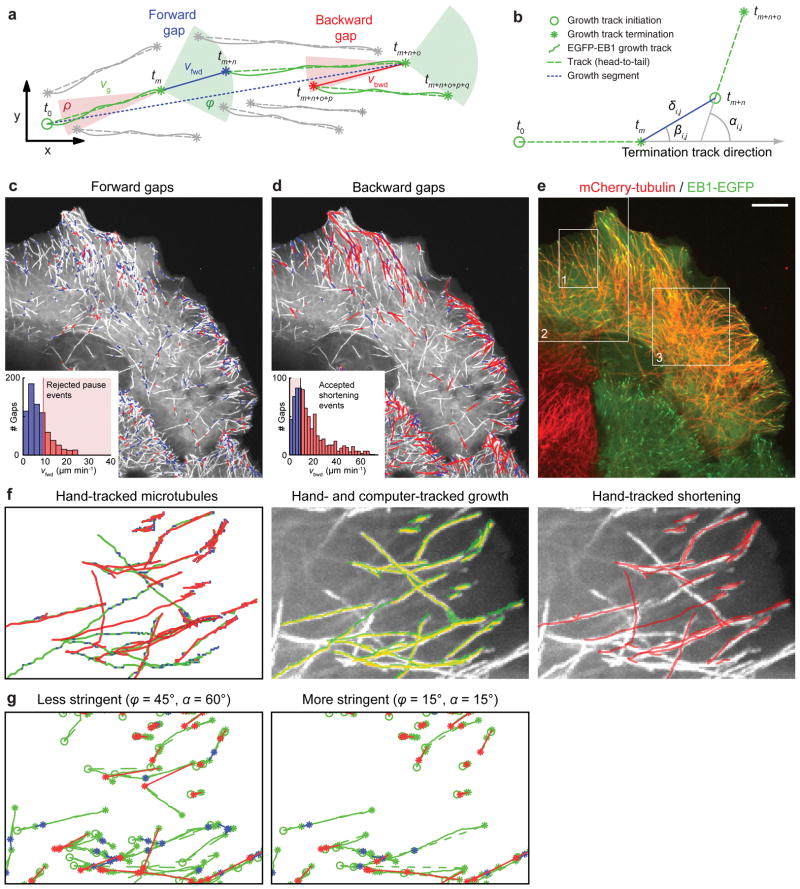
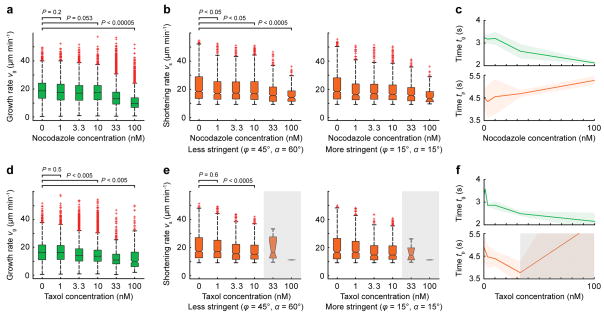
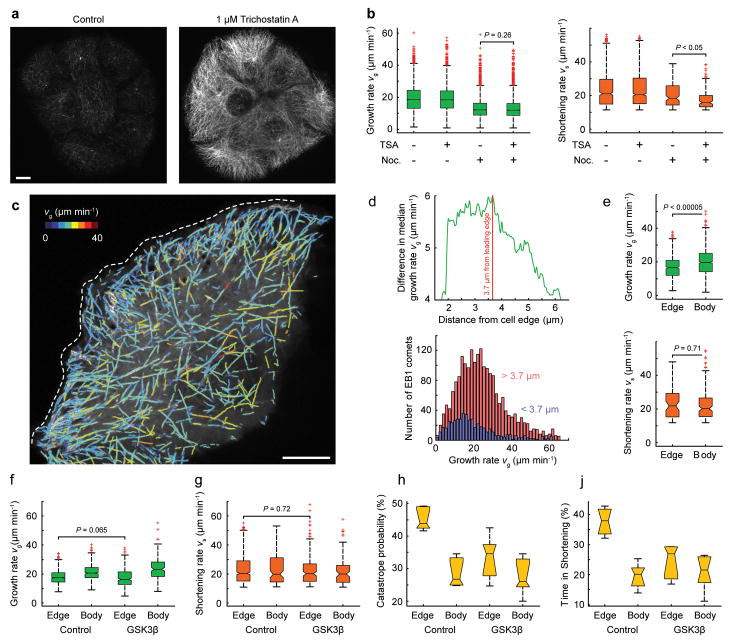
Regulation of microtubule dynamics is essential for many cell biological processes and is likely to be variable between different subcellular regions. We describe a computational approach to analyze microtubule dynamics by detecting growing microtubule plus ends. Our algorithm tracked all EB1-EGFP comets visible in an image time-lapse sequence allowing the detection of spatial patterns of microtubule dynamics. We introduce spatiotemporal clustering of EB1-EGFP growth tracks to infer microtubule behaviors during phases of pause and shortening. We validated the algorithm by comparing the results to data for manually tracked, homogeneously labeled microtubules and by analyzing the effects of well-characterized inhibitors of microtubule polymerization dynamics. We used our method to analyze spatial variations of intracellular microtubule dynamics in migrating epithelial cells.


Figures

Figure 1
Figure 1. EB1-EGFP Comet Detection
(a) Spinning disk confocal image of a cell expressing EB1-EGFP. (b) Difference of two Gaussian (DoG) transformation applied to image in a). (c) Accepted pixels (white) after unimodal intensity thresholding; The plot (right) shows the histogram of normalized DoG intensities; grey lines illustrate construction of the unimodal threshold; dashed red line, automatic threshold; solid red line, threshold modified for confocal images. (d) Average EB1-EGFP comets in a control and nocodazole-treated cell. (e) Positions and orientation of accepted comets (yellow lines, overlaid on raw image) based on automatic thresholding. The plot (right) shows the histogram of the normalized least squares difference between individual comet images and the average of all comets in this frame. (f) Contour plots show detection error (top, false positives; bottom, false negatives) as a function of σ2 and k1. The white cross indicates the detection parameters used in (a) ([σ1, σ2, k1, k2] = [1, 4, 2.5, 1]. (g) Displacement of computer-detected EB1-EGFP comet position relative to hand-detected microtubule end as a function of comet eccentricity (g) and as a function of orientation relative to the microtubule direction (h). Only comets with an eccentricity e > 0.8 (~70% of the total comet population in this image) were used in (h). Solid circle, mean displacement; error bars, s.d. (n = 95) (j, k) EB1-EGFP comet eccentricity (j) and intensity (k) are plotted versus comet speed.
Figure 2
Figure 2. EB1-EGFP Object Tracking
(a) Maximum intensity projection of EB1-EGFP time-lapse sequence (75 frames, 0.4 s frame−1). Growing microtubule ends appear as bright tracks. Scale bar, 10 μm. (b) Computer-generated growth tracks (yellow) with a minimum lifetime of 4 frames. (c) Histogram of growth velocities. The red line is the maximum search radius. (d) Histogram of growth track lifetimes. Red line, least-squares fit of a single exponential decay excluding the first data point. (e) Mean growth rates as a function of minimum growth track lifetime. Grey area, standard deviation.
Figure 3
Figure 3. EB1-EGFP Growth Track Clustering
(a) Schematic of growth track clustering. Green and red cones, spatiotemporal search space for candidate links to subsequent growth tracks at the end of a terminating growth track. Grey tracks with an initiation point inside a cone are not selected for linking by the clustering algorithm; gray tracks with an initiation point outside any cone do not participate in the clustering. vg, growth rate derived from EB1-EGFP tracks; vfwd and vbwd, inferred velocities of forward (blue) and backward (red) gaps, respectively; tx defines the time point of initiation or termination of a growth track. (b) Variables defining the cost of a candidate link between growth tracks. (c, d) Overlay of forward gaps (c) and backward gaps (d) on a maximum intensity projection of EB1-EGFP time-lapse sequence (97 frames, 0.6 s frame−1). Blue, slow gaps; red, fast gaps. Insets, histograms of forward (c) and backward (d) gap speeds and unimodal thresholds used to reject fast (c) and slow (d) gaps. (e) Image of cell expressing mCherry-tubulin and EB1-EGFP. Boxes indicate image regions used for validation. Scale bar, 10 μm. (f) Left, hand-tracking of 19 microtubules in region 1 indicated in (e). Periods of growth (green), shortening (red), and pauses (blue) are shown; middle, hand-tracked (green) and computer-tracked (yellow) growth; right, hand-tracked shortening overlaid on the EB1-EGFP maximum intensity projection of the entire sequence. (g) Track clusters obtained by two different settings for the cone openings. Color coding for lines, circles (growth track start) and asterisks (growth track and gap ends) as in (a).
Figure 4
Figure 4. Effects of Microtubule Inhibitors
(a, d) Growth rates, (b, e) inferred shortening rates using two different sets of clustering parameters and (c, f) times spent in growth and pause as a function of (ac) nocodazole, and (df) taxol concentration. The shaded areas in c and f indicate the standard deviation, and the grey area in the taxol experiment indicates unreliable results due to very few growing microtubules (< 5–10% of control), which resulted in low clustering efficiency. Data is pooled from n = 3 cells for both experiments; distributions comprise n > 3000 measurements for each concentration except those in the gray areas. Statistical significance of the difference between concentrations is determined by a permutation t-test (see Methods).
Figure 5
Figure 5. Effects of Tubulin Acetylation and Spatiotemporal microtubule Regulation in Migrating Cells
(a) Immunofluorescence staining of acetylated microtubules in control and Trichostatin A-treated cells. (b) Growth and shortening rates in the presence of the indicated compounds. Data pooled from n = 3 cells (each distribution comprises n > 3000 measurements) and tested by permutation t-test (see Methods). (c) Computed growth tracks overlaid on a maximum intensity projection of an EB1-EGFP time-lapse sequence at the edge of a cell monolayer (77 frames, 0.4 s frame−1). Growth tracks are color-coded by growth rate as indicated; the dashed white line indicates the leading edge. (d) Difference in median growth rate of microtubule populations in the cell body (red) and cell edge (blue) as a function of distance from the edge. The plot below shows the regionally separated histograms of growth rates. (e) Growth and inferred shortening rates in the cell body and at the cell edge. (f) Growth and (g) inferred shortening rates, (h) catastrophe probability (estimated as the fraction of backward links in the total population of links), and (j) the time spent shortening, in regions of the cell edge compared to the cell body in control and GSK3β (S9A)-expressing cells. (e – g) Data pooled from n = 6 cells (distributions comprise n > 3000 measurements) and tested by permutation t-test (see Methods). Scale bars, 10 μm.

Comment in

References

    1. Desai A, Mitchison TJ. Microtubule polymerization dynamics. Annu Rev Cell Dev Biol. 1997;13:83–117. - PubMed
    1. Sammak PJ, Borisy GG. Direct obsrevation of microtubule dynamics in living cells. Nature. 1988;332 (6166):724–726. - PubMed
    1. Rusan NM, Fagerstrom CJ, Yvon AMC, Wadsworth P. Cell cycle-dependent changes in microtubule dynamics in living cells expressing green fluorescent protein-alpha tubulin. Mol Biol Cell. 2001;12 (4):971–980. - PMC - PubMed
    1. Wittmann T, Bokoch GM, Waterman-Storer CM. Regulation of leading edge microtubule and actin dynamics downstream of Rac1. J Cell Biol. 2003;161 (5):845–851. - PMC - PubMed
    1. Altinok A, et al. Model based dynamics analysis in live cell microtubule images. BMC Cell Biol. 2007;8 (Suppl 1):S4. - PMC - PubMed

Publication types

MeSH terms