. 2010 Sep;9(9):768-78.
doi: 10.1038/nmat2812. Epub 2010 Aug 22.

Combinatorial development of biomaterials for clonal growth of human pluripotent stem cells

Affiliations

Combinatorial development of biomaterials for clonal growth of human pluripotent stem cells

Ying Mei et al. Nat Mater. 2010 Sep.

Abstract

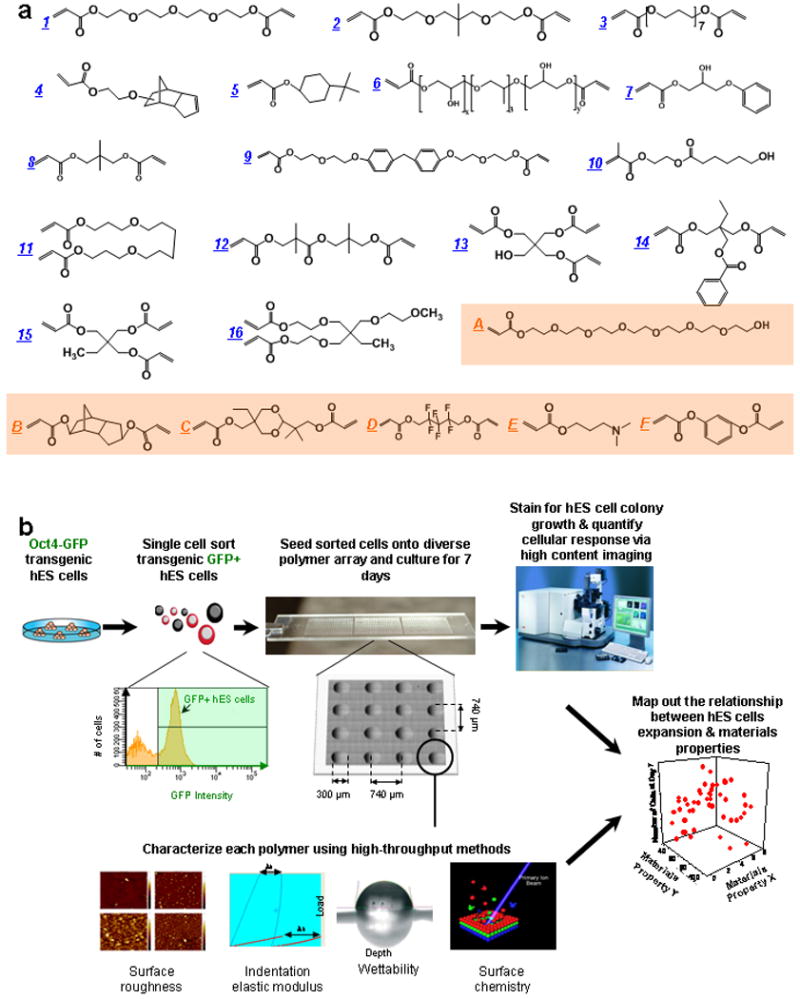
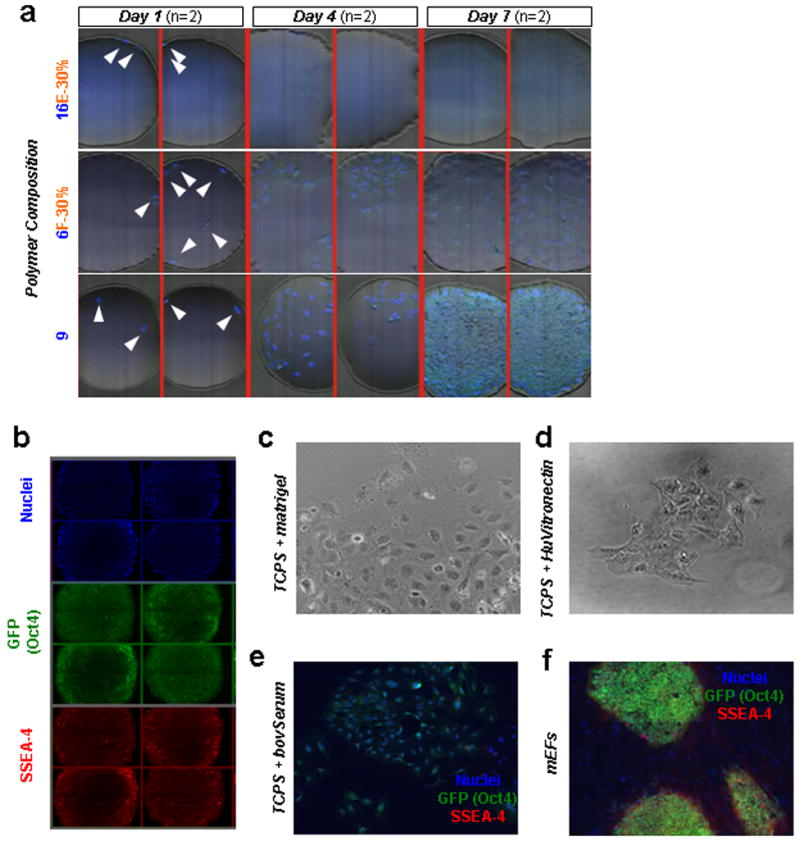
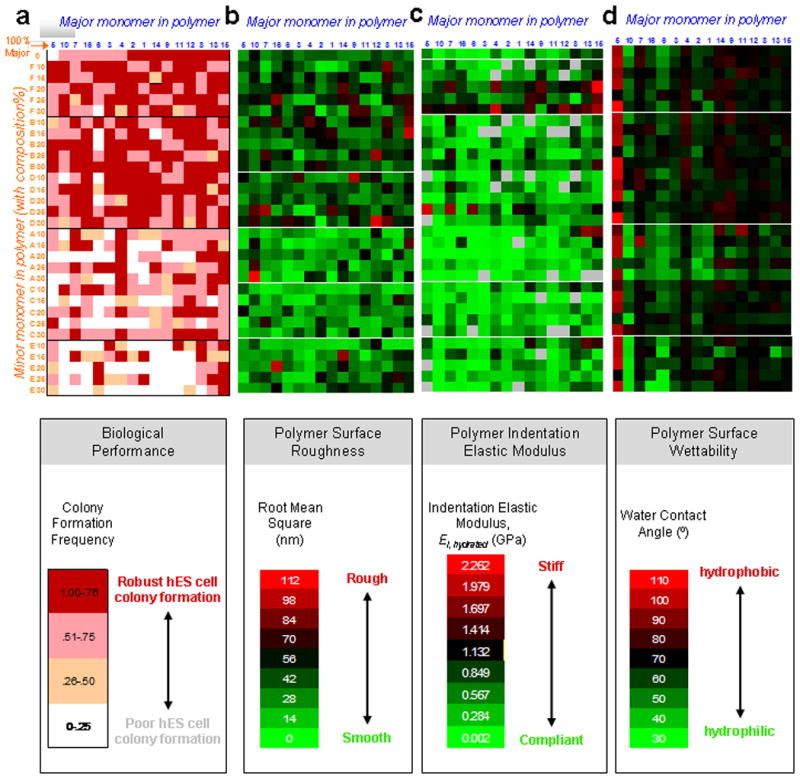
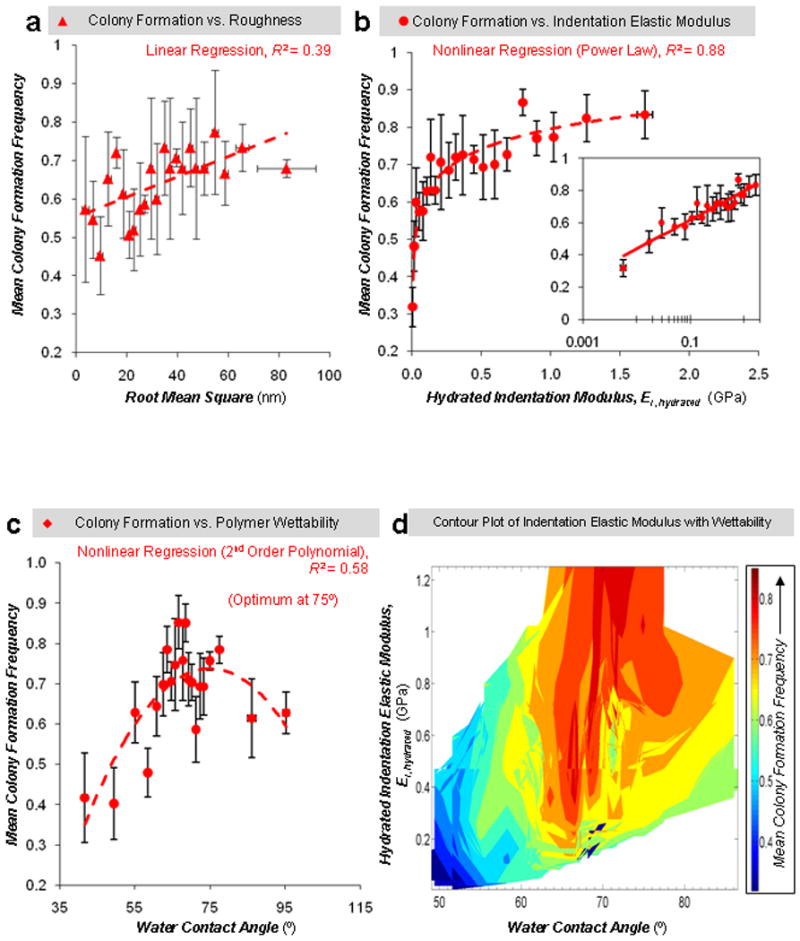
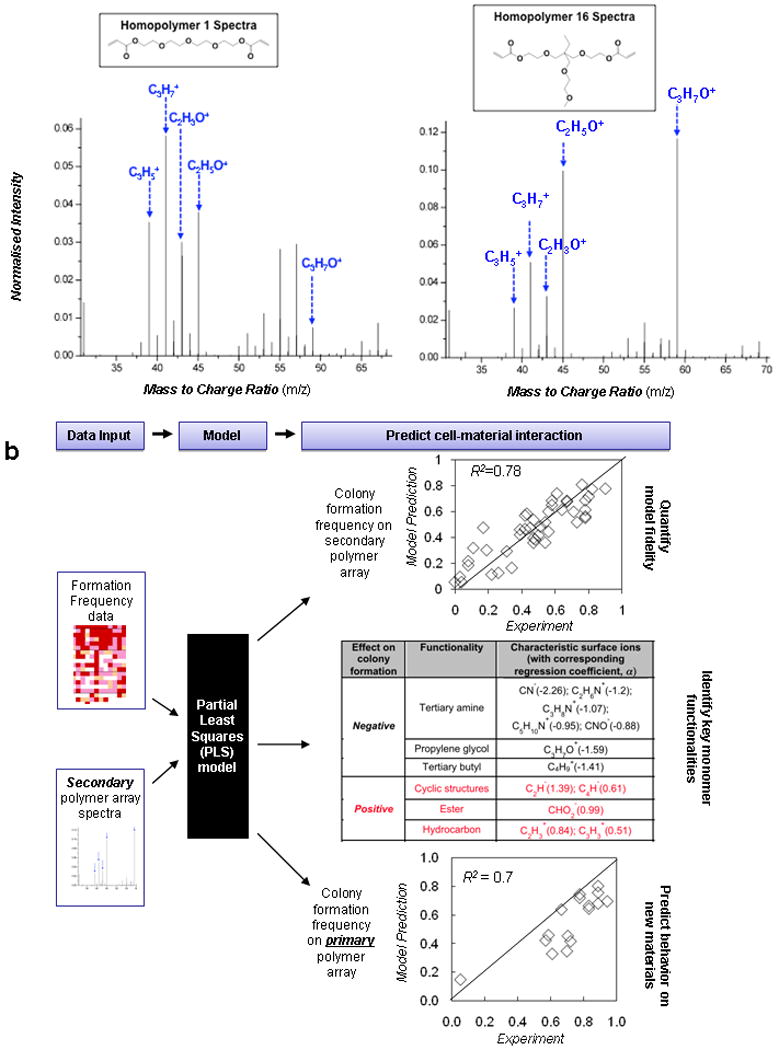
Both human embryonic stem cells and induced pluripotent stem cells can self-renew indefinitely in culture; however, present methods to clonally grow them are inefficient and poorly defined for genetic manipulation and therapeutic purposes. Here we develop the first chemically defined, xeno-free, feeder-free synthetic substrates to support robust self-renewal of fully dissociated human embryonic stem and induced pluripotent stem cells. Material properties including wettability, surface topography, surface chemistry and indentation elastic modulus of all polymeric substrates were quantified using high-throughput methods to develop structure-function relationships between material properties and biological performance. These analyses show that optimal human embryonic stem cell substrates are generated from monomers with high acrylate content, have a moderate wettability and employ integrin alpha(v)beta(3) and alpha(v)beta(5) engagement with adsorbed vitronectin to promote colony formation. The structure-function methodology employed herein provides a general framework for the combinatorial development of synthetic substrates for stem cell culture.


Figures

Figure 1
Figure 1. High-throughput screening of biomaterials for clonal growth
a, Monomers used for array synthesis were classified into two categories: “major” monomers that constitute >50% of the reactant mixture and “minor” monomers that constitute <50% of the mixture. Sixteen major monomers were named numerically (blue), and six minor monomers were labeled alphabetically (orange). b, Schematic of screen. First, transgenic Oct4-GFP hES cells were maintained on mEFs. Then flow cytometry enabled the isolation of high purity undifferentiated hES cells from the completely dissociated coculture of hES cells and mEFs. A flow cytometry histogram during a representative cell sort is shown. GFP+ cells (right of the black gate) were seeded onto the arrays, while the differentiated cells and mEFs (GFP-, left of the black gate) were not utilized. A photograph of the polymer microarray with 16 polymer spots is shown to illustrate dimensions and separation. Each polymer was also characterized using high-throughput methods to characterize its surface roughness, indentation elastic modulus, wettability (water contact angle, θC) and surface chemistry. Finally, cellular response on polymer array was quantified by using laser-scanning cytometry, and structure-function relationships were determined by numerical analysis of both the cellular response and materials characterization data.
Figure 2
Figure 2. Diverse hES cell behavior on primary polymer arrays
a, Single Oct4-GFP+ hES cells were seeded on the polymer arrays. White arrowheads point to cells attached after one day of culture, indicating a near clonal seeding density for each spot. Diverse cell behavior was seen on the array upon subsequent culture in mEF-conditioned media. Representative images of cell nuclei (stained by Hoechst in blue) on three different polymers (shown are two replicates of each): the 16E-30% polymer did not support either attachment or survival of dissociated hES cells; the 6F-30% supported moderate growth but also differentiation of hES cells; the 9 homopolymer (a “hit” polymer) supported robust growth of hES cells. b, Immunostaining of hES cells propagated on “hit” polymer spots for cell nuclei (blue) and for pluripotency markers Oct4 (green) and SSEA4 (red). Due to the raised center of each spot above the plane of the microscope slide, spot centers are not completely in focus, leading to lower intensity at the center of each image. c-e, At the near clonal cell densities used for the polymer experiments, hES cells spread out on matrigel-coated tissue culture polystyrene (TCPS), vitronectin-coated TCPS, and bovine serum-coated TCPS substrates in mEF-conditioned media. f, In contrast, traditional means of culturing hES cells by using mitotically-inactivated mouse embryonic feeder cells grown on gelatin-coated TCPS (“MEF substrate”) could support colony formation at these near clonal cell densities. In e and f, immunostaining was performed for nuclei (blue) and for pluripotency markers Oct4 (green) and SSEA-4 (red). See also Figure 6a for colony formation efficiencies.
Figure 3
Figure 3. Mapping hES cell behavior to polymer properties using primary arrays
a, Map of hES cell colony formation and polymer composition for all of the 496 monomer combinations in the primary array. For the minor and major composition axes, the numbers and letters indicate the major and minor monomer, respectively, as shown in Figure 1a. Major monomer are listed in order, from left to right, of increasing colony formation, while minor monomers are listed in order of increasing colony formation from bottom to top. Therefore, the region of the map corresponding to highest colony formation is the top right corner, while the region with the lowest is the bottom left corner. Homopolymers are listed at on the upper row. The frequency of colony formation on the primary polymer array was grouped into four categories 0-0.25, 0.25-0.50, 0.50-0.75, and 0.75-1.0 per polymeric spot, as indicated by the intensity of red. b, Surface roughness of primary array polymers coated with FBS in DMEM medium. Map indicating root mean square roughness (see colored legend below) for all of the 496 monomer combinations in the primary array. c, Indentation elastic modulus of primary array polymers hydrated in PBS. Map indicating indentation elastic modulus (see colored legend below) for all of the 496 monomer combinations in the primary array. Grey indicates no data obtained. d, Wettability of primary array polymers. Map indicating water contact angle (see colored legend below) for all of the 496 monomer combinations in the primary array. Note that polymers in the upper right corner of part a with higher colony formation frequencies (dark red) have moderate water contact angles (black) in the upper right corner of part d, whereas this region does not correlate to any specific ranges of roughness or elastic modulus in the upper right corner of parts b & c.
Figure 4
Figure 4. Correlating hES cell behavior to polymer properties using primary arrays
Using data in Figure 3, regression was performed for two properties listed at the top of each plot: colony formation vs. polymer roughness (a), colony formation vs. polymer indentation elastic modulus in the hydrated state (b), colony formation vs. wettability (c), and colony formation as a function of both polymer wettability and indentation elastic modulus in the hydrated state (d). After performing linear regression, 2nd order polynomial regression, and power law regression, only the regression with the highest R2 is shown in each plot (dashed line). Insets in parts b are in semi-log format to indicate behavior at low modulus values. Data is sorted into groups of 20-25 spots as a function of increasing WCA, roughness, or modulus. For contour plot, interpolation between data points (groups of 20-25 spots) was performed on Matlab (see methods). Abscissa error bars represent the standard error of the WCA, roughness, or modulus for a given group of 20-25 spots. In plots a, b, and c, ordinate error bars represent the standard error of the mean of the colony formation frequency of three replicates for a given group.
Figure 5
Figure 5. Mapping cell behavior to surface chemistry using secondary arrays
a, ToF-SIMS spectra of homopolymers 1 and 16 indicating that the surface chemistry cannot be necessarily predicted from the monomer chemistry. Arrows delineate higher intensities of hydrocarbon secondary ions (C3H5+, C3H7+) and ester ions (C2H3O+) in the homopolymer 1 spectra. In contrast, higher intensity of ethylene glycol ions (C2H5O+) and propylene glycol ions (C3H7O+) were observed in the homopolymer 16 spectra. See full analysis of ToF-SIMS spectra in Supplementary Figure S12. b, A multivariate partial least squares (PLS) regression method was utilized to quantitatively analyze and predict the cell/materials interactions by correlating ToF-SIMS spectra of polymer spots to their biological performance (colony formation frequency). The fidelity of PLS models can be quantified by a linear correlation of predicted versus measured colony formation frequency. Top: Each spot in the figure represent one of 48 different polymers in the secondary array, and the inserted line represents the ideal situation when prediction match experiments completely. All ions and their regression coefficients, “α”, are listed in Supplementary Figure S12a. Middle table: Functionalities and their associated characteristic ions supporting or inhibiting hES cell growth. Ions were identified by correlating ToF-SIMS spectra to hES cell growth using PLS regression. Each ion was designated with a regression coefficient, α, that characterizes the relative effect on hES cell colony formation. Bottom: As in top plot, but the PLS model was developed on ToF-SIMS spectra from the secondary array (with α's listed in middle table) and was used to predict behavior in the primary array.
Figure 6
Figure 6. Short- and long-term feeder-free culture on hit polymer arrays
a, Efficiencies of various culture systems to support undifferentiated growth of dissociated hES cells. Two media conditions were used, labeled at the bottom: mEF-conditioned media (MEF-CM) or chemically defined media (mTeSR1). Several combinations of substrate and protein coating were used in conjunction with these media. Three substrates consisted of tissue culture polystyrene (TCPS), hit polymer 9 (“9”; see Figure 1a for monomer structure), and hit polymer 15A-30% (“15A”; see Figure 1a for monomer structures). Four protein coatings consisted of matrigel, bovine serum, human serum, and human vitronectin. Lastly, mEFs on gelatin-coated TCPS in regular hES media was also used. In each condition, efficiencies were calculated as the number of SSEA-4+ and Oct4+ colonies seen on day 7 normalized to the number of cells attached on day 1. This metric specifically reflects the ability of substrates to promote undifferentiated clonal cell growth after correcting for any differences in initial cell attachment. b, Immunostaining of dissociated hES cells propagated on hit FBS-coated “15A-30%” polymer for 7 days against Nanog (green) and Tra-1-60 (red), and on FBS-coated hit “9” polymer for 7 days against Oct4 (green) and SSEA-4 (red). Immunostaining of dissociated hiPS cells propagated on hit “15A-30%” polymer for 7 days; SSEA-4 (red) and cell nuclei (blue). For these studies, hiPS cells were immunostained against SSEA-4, and then the SSEA4+ sorted cell population was used. c, Karyotypic analysis of hES cells propagated on hit “9” polymer array for more than 2 months (>10 passages). A normal 46XY karyotype was maintained on the hit array. d, Gene expression analyses via RT-PCR of various differentiation markers for the three germ layers generated through embryoid body (EB) in vitro differentiation. Lane labels are as follows: “M-EB” for EBs generated from hES cells cultured on mEFs, “9-EB” and “15-EB” for EBs generated from hES cells cultured on 9 and 15A-30% hit polymer arrays respectively, and “9-ES” and “15-ES” for hES cells cultured on 9 and 15A-30% hit polymer arrays respectively. e, Teratoma formation in immunodeficient mice by cells cultured on “15A-30%” hit arrays. H&E staining was performed on the teratoma. Resulting teratoma contained tissues representing all three germ layers: ectoderm, epidermal and neural tissue (rosette); mesoderm, bone and cartilage; and endoderm, respiratory epithelium and intestinal-like epithelium. f, Fraction of adhered cells after 24 hr of culture in mTeSR1 media on hit polymer arrays coated with either human serum (HuSerum) or human vitronectin (HuVitronectin) and with the specified integrin blocking antibody. Cell number shown here are averages of 24 replicates of the following hit polymers: 15, 15B-10%, 15B-20%, 15B-25%, 15D-10, and 15D-20%. β1 blocking had minimal effect either alone or in combination with αvβ5 and αvβ3 blocking, whereas both αvβ5 and αvβ3 blocking reduced adhesion.

References

    1. Thomson JA, et al. Embryonic stem cell lines derived from human blastocysts. Science. 1998;282:1145–1147. - PubMed
    1. Takahashi K, et al. Induction of pluripotent stem cells from adult human fibroblasts by defined factors. Cell. 2007;131:861–872. - PubMed
    1. Yu J, et al. Induced pluripotent stem cell lines derived from human somatic cells. Science. 2007;318:1917–1920. - PubMed
    1. Daley GQ, Scadden DT. Prospects for stem cell-based therapy. Cell. 2008;132:544–548. - PubMed
    1. Saha K, Jaenisch R. Technical challenges in using human induced pluripotent stem cells to model disease. Cell Stem Cell. 2009;5:584–595. - PMC - PubMed

Publication types

MeSH terms

Substances