Comparative Study
. 2010 Sep;42(9):806-10.
doi: 10.1038/ng.650. Epub 2010 Aug 22.

ChIP-Seq identification of weakly conserved heart enhancers

Affiliations
Comparative Study

ChIP-Seq identification of weakly conserved heart enhancers

Matthew J Blow et al. Nat Genet. 2010 Sep.

Abstract

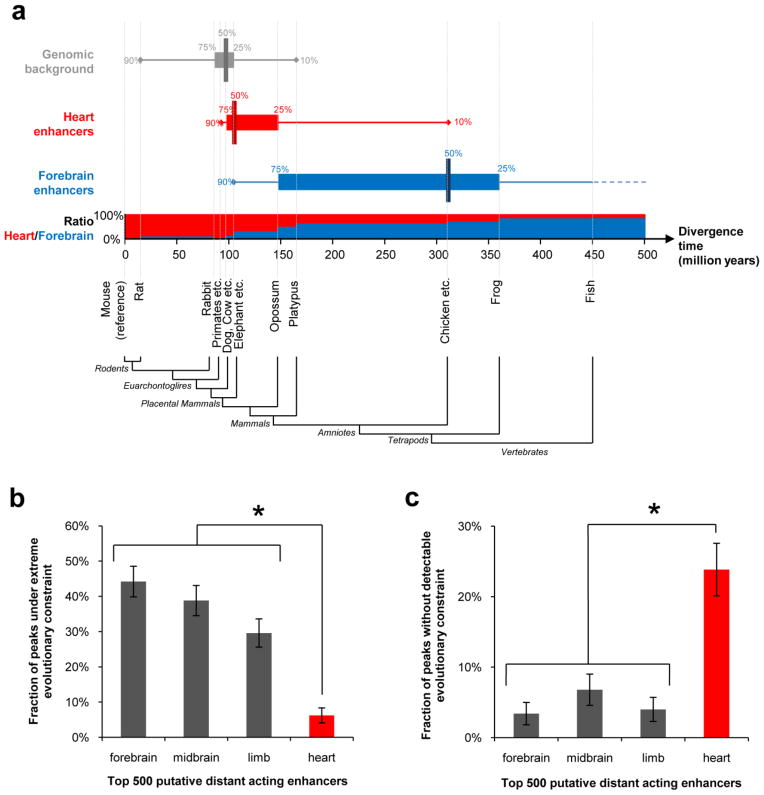
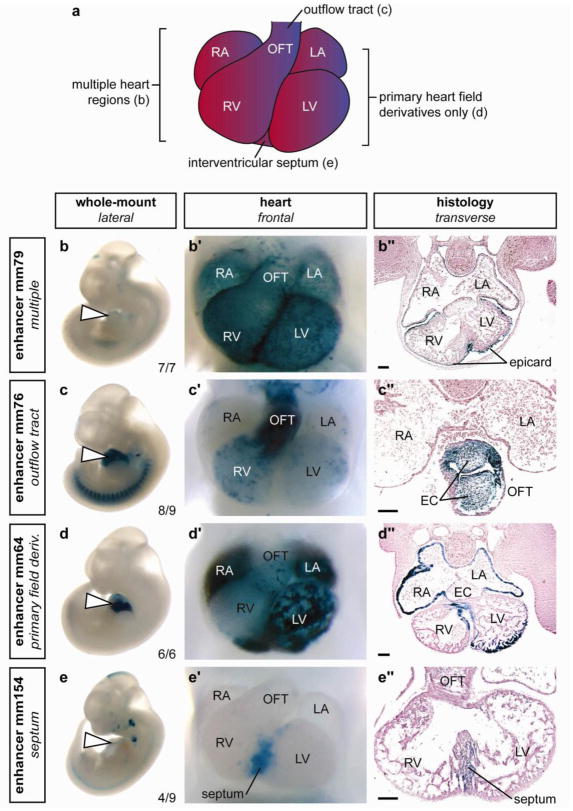
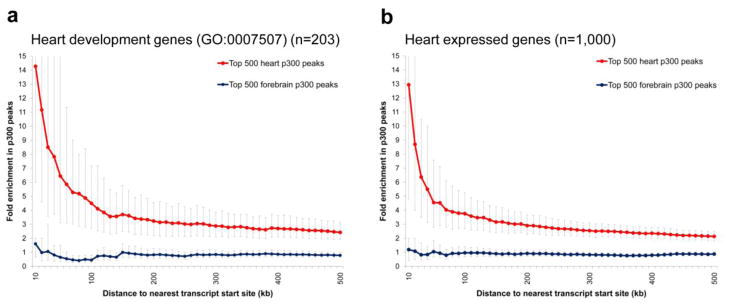
Accurate control of tissue-specific gene expression plays a pivotal role in heart development, but few cardiac transcriptional enhancers have thus far been identified. Extreme noncoding-sequence conservation has successfully predicted enhancers that are active in many tissues but has failed to identify substantial numbers of heart-specific enhancers. Here, we used ChIP-Seq with the enhancer-associated protein p300 from mouse embryonic day 11.5 heart tissue to identify over 3,000 candidate heart enhancers genome wide. Compared to enhancers active in other tissues we studied at this time point, most candidate heart enhancers were less deeply conserved in vertebrate evolution. Nevertheless, transgenic mouse assays of 130 candidate regions revealed that most function reproducibly as enhancers active in the heart, irrespective of their degree of evolutionary constraint. These results provide evidence for a large population of poorly conserved heart enhancers and suggest that the evolutionary conservation of embryonic enhancers can vary depending on tissue type.


Conflict of interest statement

The authors declare no competing financial interests.

Figures

Figure 1
Figure 1. Weak evolutionary conservation of candidate heart enhancers identified by p300-binding in embryos at e11.5
In order to compare equally sized high-confidence samples, analyses were performed on the 500 most significantly p300-bound regions from each tissue (see Methods). a) Comparison of the evolutionary conservation properties of heart and forebrain enhancers identified through p300 binding in e11.5 tissues. Conservation depth of enhancers was defined as the estimated divergence time from mouse of the most distantly related species with aligned genomic sequence, (see Methods). Median (vertical bar), 25 to 75% percentile (horizontal bar) and 10 to 90% percentile (horizontal line) intervals of conservation depth are shown for forebrain enhancers (blue), heart enhancers (red) and the genomic background (10,000 randomly selected regions from the mouse genome with size, sequence mappability and repeat composition matched to candidate enhancers). The horizontal axis represents the mouse evolutionary lineage, with vertical dashed lines indicating the estimated divergence times of species or groups of species with sequenced genomes included in the analysis. For each interval on the mouse lineage, the bar chart shows the ratio of forebrain enhancers to heart enhancers among enhancers that are maximally conserved to that interval. b,c) 1 kb regions flanking p300 peaks from each tissue were assigned the score of the most highly constrained overlapping vertebrate phastCons element in the mouse genome. b) Fraction of candidate enhancers that are under strong evolutionary constraint (score > 600). c) Fraction of candidate enhancers that are under no detectable constraint (no overlapping vertebrate constrained element). Error bars represent 95% binomial proportion confidence interval. *, P < 10−14, Fisher’s Exact Test, one-tailed.
Figure 2
Figure 2. In vivo testing of p300 heart enhancer predictions
a) Comparison of the frequency of positive heart enhancers among previously tested sequences predicted on the basis of extreme evolutionary constraint,, and sequences predicted by heart p300 ChIP-seq. *, P < 10−55, Fisher’s Exact Test, one-tailed. b) Frequency of positive heart enhancers among tested sequences exhibiting different degrees of evolutionary sequence constraint (highly constrained, score > 450; moderately constrained, score 350–450; weakly constrained score <350; No detectable constraint, no overlapping constrained element). Error bars represent 95% binomial proportion confidence interval. n.s., not significant (P > 0.05, all pair-wise comparisons, Fisher’s Exact Test, two-tailed).
Figure 3
Figure 3. Examples of the diverse structural and cell type specificities of p300 ChIP-seq identified cardiac enhancers
a) Schematic of mouse embryonic day 11.5 heart. b–e) Side views of whole embryos, b′–e′) magnified ventral views of hearts and b″– e″) transverse sections through the heart region are shown for each of four representative X-gal-stained embryos with in vivo enhancer activity at e11.5. Element ID and reproducibility of expression patterns are indicated alongside whole embryo images. b) Enhancer with activity exclusively in epicardium in all anatomical regions of the heart. c) Enhancer with activity primarily in outflow tract endocardium and in all endocardial cushion (EC) mesenchyme. d) Enhancer primarily active in derivatives of the primary heart field (atrial and ventricular myocardium and a small region of the interventricular septum). e) Enhancer with activity predominantly in the muscular portion of the interventricular septum. RA, right atrium; LA, left atrium; RV, right ventricle; LV, left ventricle; OFT, outflow tract; epicard, epicardium. The bars in panels showing transverse sections are equal to 100 μm. The complete in vivo expression dataset is available online.
Figure 4
Figure 4. Enrichment of heart p300 ChIP-seq peaks near genes implicated in heart development
Enrichment of heart and forebrain p300 peaks in the proximity of transcript start sites of a) heart development genes (GO:0007507), and b) the 1000 most highly expressed genes in e11.5 mouse heart . Fold-enrichment was determined by comparing the observed frequency of peaks up to 500 kb away from transcript start sites to an equal number of randomized positions genome-wide. For each tissue, only the 500 most significant p300 peaks were considered. Similarly specific enrichment of heart peaks near heart genes is observed compared with limb and midbrain p300 data, whereas no enrichment of heart peaks is observed near control gene sets with no known role in heart development or with no expression in e11.5 hearts (see Supplementary Figs. 8–10). Bold lines represent average fold enrichment; error bars indicate confidence intervals (5th- and 95th-percentile, see Methods).

Comment in

References

    1. Hoffman JI, Kaplan S, Liberthson RR. Prevalence of congenital heart disease. Am Heart J. 2004;147:425–39. - PubMed
    1. Lloyd-Jones D, et al. Heart disease and stroke statistics--2009 update: a report from the American Heart Association Statistics Committee and Stroke Statistics Subcommittee. Circulation. 2009;119:480–6. - PubMed
    1. Pierpont ME, et al. Genetic basis for congenital heart defects: current knowledge: a scientific statement from the American Heart Association Congenital Cardiac Defects Committee, Council on Cardiovascular Disease in the Young: endorsed by the American Academy of Pediatrics. Circulation. 2007;115:3015–38. - PubMed
    1. Bruneau BG. The developmental genetics of congenital heart disease. Nature. 2008;451:943–8. - PubMed
    1. Bentham J, Bhattacharya S. Genetic mechanisms controlling cardiovascular development. Ann N Y Acad Sci. 2008;1123:10–9. - PubMed

Publication types

Associated data