. 2010 Sep;17(9):1124-35.
doi: 10.1038/nsmb.1884. Epub 2010 Aug 22.

14-3-3 adaptor proteins recruit AID to 5'-AGCT-3'-rich switch regions for class switch recombination

Affiliations

14-3-3 adaptor proteins recruit AID to 5'-AGCT-3'-rich switch regions for class switch recombination

Zhenming Xu et al. Nat Struct Mol Biol. 2010 Sep.

Abstract

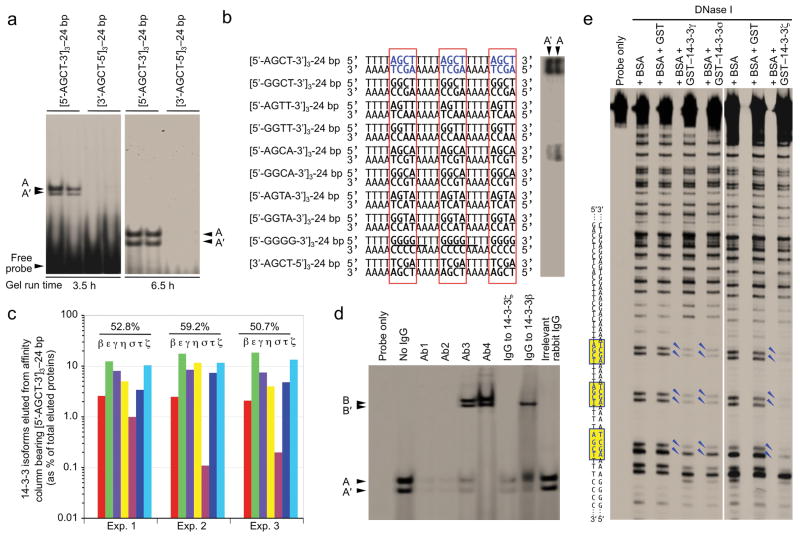
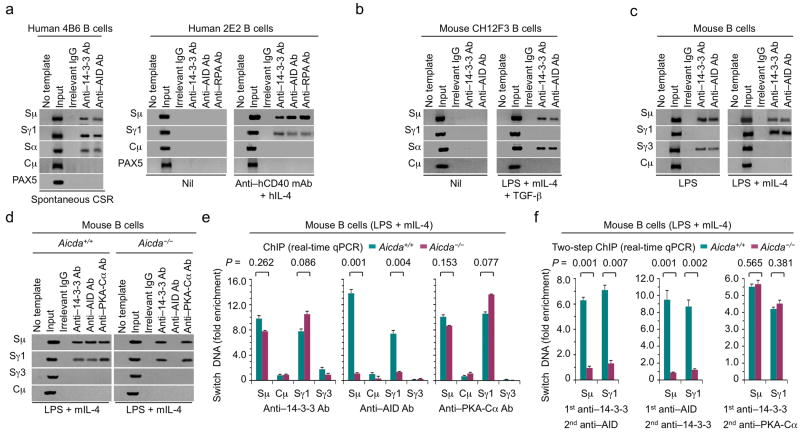
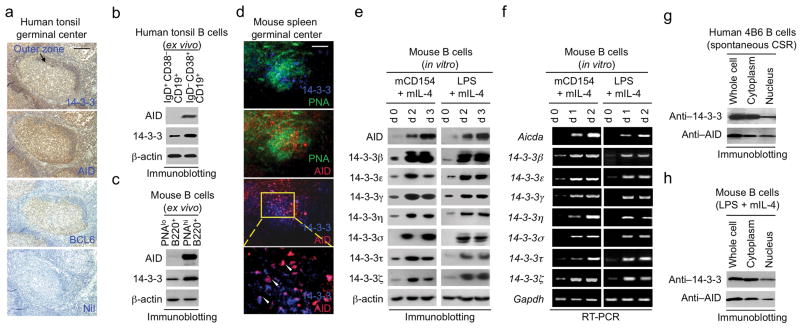
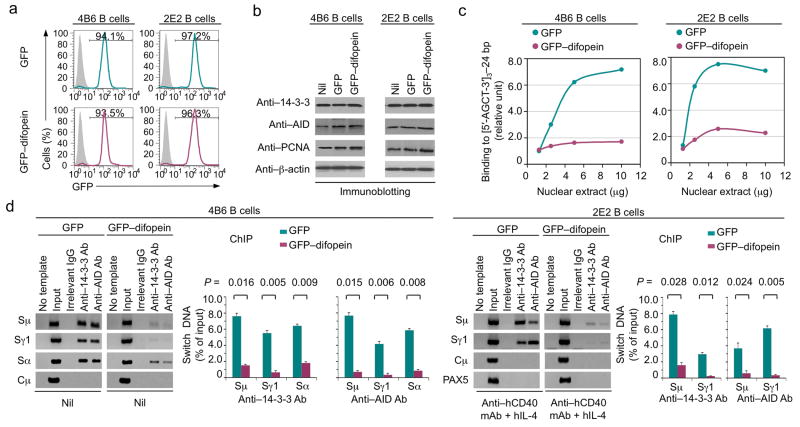
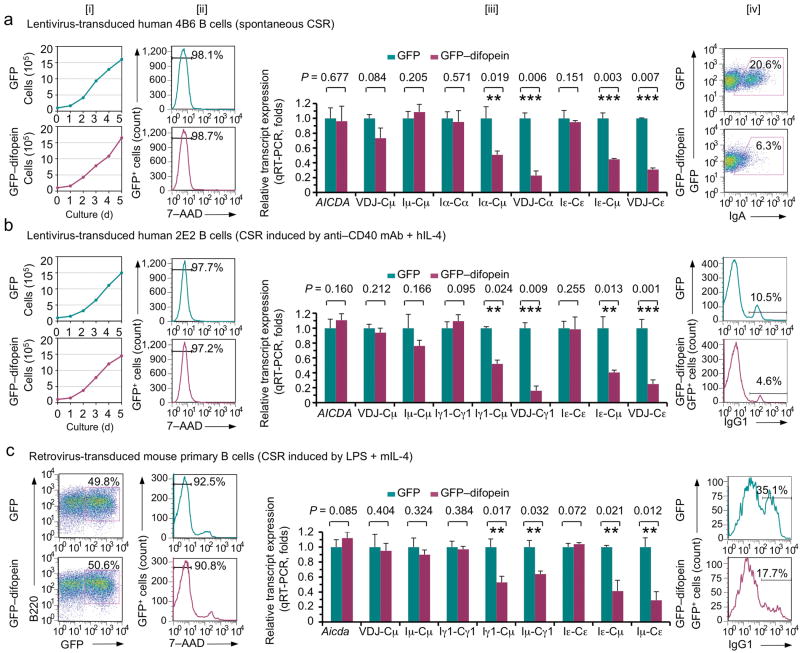
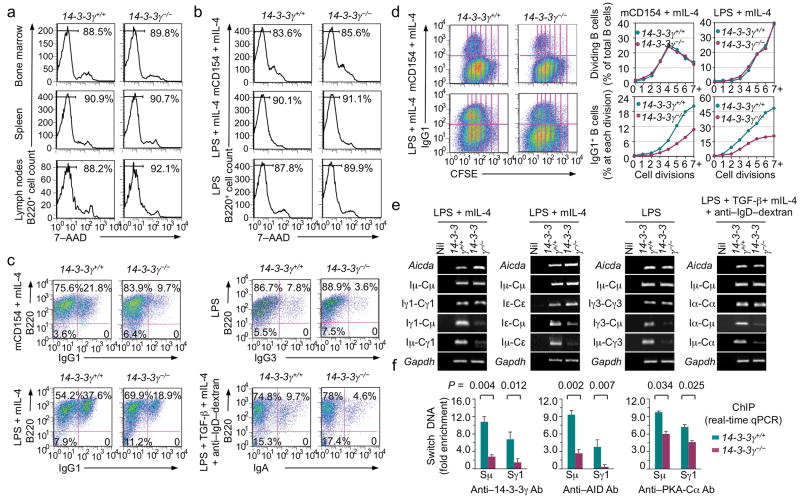
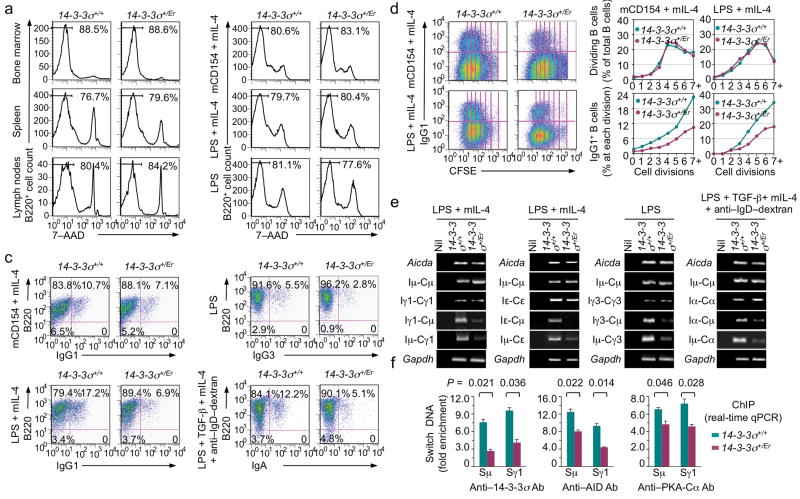
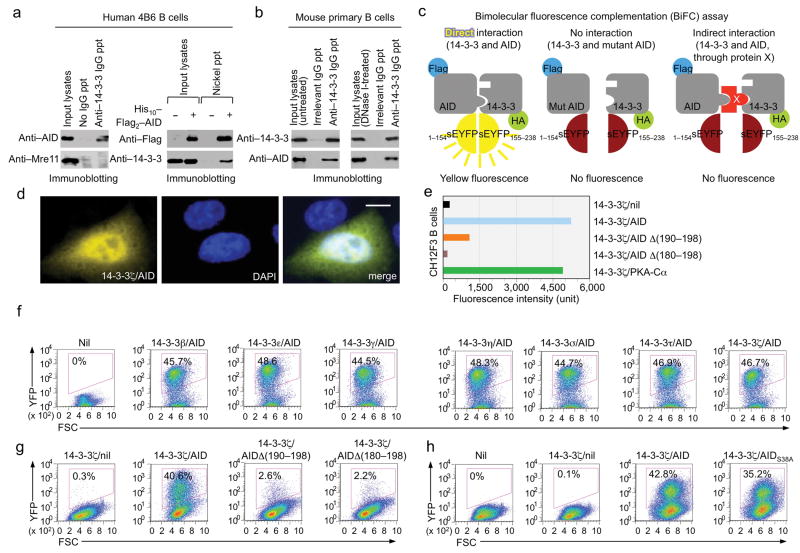
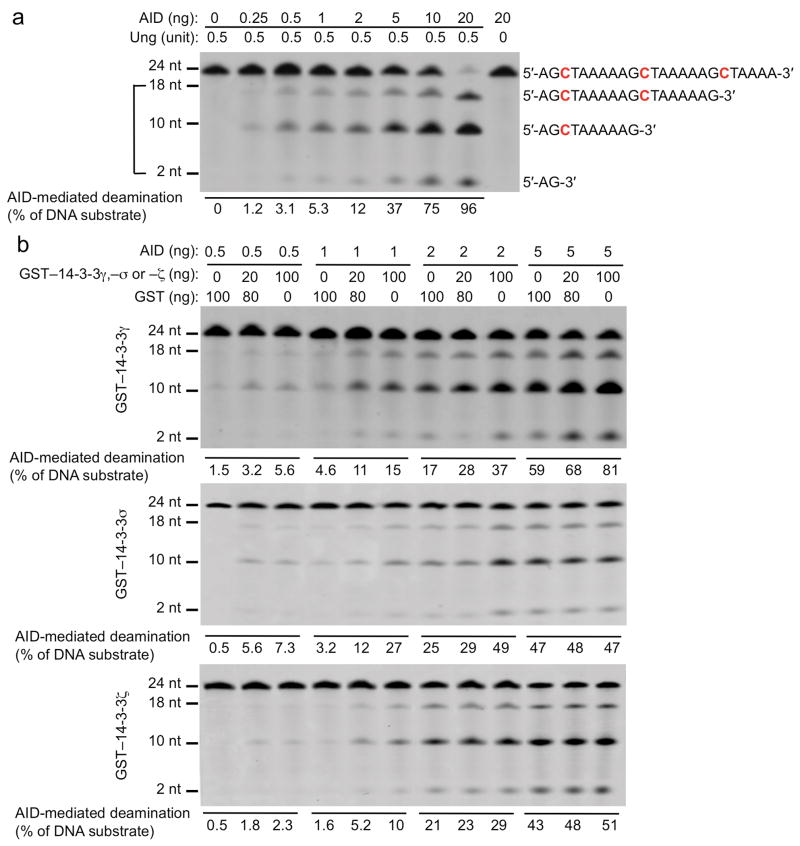
Class switch DNA recombination (CSR) is the mechanism that diversifies the biological effector functions of antibodies. Activation-induced cytidine deaminase (AID), a key protein in CSR, targets immunoglobulin H (IgH) switch regions, which contain 5'-AGCT-3' repeats in their core. How AID is recruited to switch regions remains unclear. Here we show that 14-3-3 adaptor proteins have an important role in CSR. 14-3-3 proteins specifically bound 5'-AGCT-3' repeats, were upregulated in B cells undergoing CSR and were recruited with AID to the switch regions that are involved in CSR events (Smu-->Sgamma1, Smu-->Sgamma3 or Smu-->Salpha). Moreover, blocking 14-3-3 by difopein, 14-3-3gamma deficiency or expression of a dominant-negative 14-3-3sigma mutant impaired recruitment of AID to switch regions and decreased CSR. Finally, 14-3-3 proteins interacted directly with AID and enhanced AID-mediated in vitro DNA deamination, further emphasizing the important role of these adaptors in CSR.


Conflict of interest statement

Competing Interests Statements: The authors declare no competing financial interests.

Figures

Figure 1
Figure 1
14-3-3 proteins bind to 5′-AGCT-3′ repeats. (a) EMSA with nuclear extracts from spontaneously switching human 4B6 B cells and the [5′-AGCT-3′]3–24 bp or the control [3′-AGCT-5′]3–24 bp oligonucleotide probe. Duplicate samples were separated in a 7% native PAGE gel for 3.5 h (left panel) or 6.5 h (right panel, free probes ran off the gel). (b) EMSA with 4B6 B cell nuclear extracts and the [5′-AGCT-3′]3–24 bp oligonucleotide probe or oligonucleotide probes containing three repeats of the other seven iterations of 5′-RGYW-3′, 5′-GGGG-3′ (5′-GGGG-3′ is part of 5′-GGGGT-3′, as underlined) or 3′-AGCT-5′. (c) Relative amount of each of the seven 14-3-3 isoforms in the total proteins eluted from the [5′-AGCT-3′]3–24 bp oligonucleotide affinity column in three independent experiments (MudPIT analysis). The combined amounts of the seven 14-3-3 isoforms are indicated. (d) 14-3-3 proteins were present in complexes containing B cell nuclear extract proteins and the [5′-AGCT-3′]3–24 bp oligonucleotide probe. Abs recognizing all 14-3-3 isoforms (Ab1, ab6081; Ab2, sc-629; Ab3, sc-13959; Ab4, ab9063) or specific isoforms (14-3-3ζ or -β) blocked formation of the A and/or A′ complexes or shifted them to form B and/or B′. (e) Footprint showing protection from DNase I digestion of the three 5′-AGCT-3′ motifs (highlighted in yellow) in the 126-bp oligonucleotide by GST–14-3-3γ, GST–14-3-3σ or GST–14-3-3ζ, but not BSA or BSA plus GST (arrowheads indicate protected dG and dC).
Figure 2
Figure 2
14-3-3 adaptors bind to the S regions involved in ongoing CSR. (a) ChIP assays involving chromatin from human IgM+ IgD+ 4B6 B cells and Ab to 14-3-3 or AID, and specifying Sμ, Sγ1, Sα (Sα1/Sα2), Cμ and PAX5 DNA (left); or chromatin from human 2E2 B cells stimulated by nil or mAb to hCD40 plus hIL-4, and specifying Sμ, Sγ1, Cμ and PAX5 DNA precipitated by Ab to 14-3-3, AID or RPA (right). (b,c) ChIP assays involving chromatin from mouse IgM+ CH12F3 B cells stimulated by nil or LPS, mIL-4 plus TGF-β and specifying Sμ, Sγ1, Sα and Cμ DNA (b), or chromatin from mouse primary B cells (B220+) stimulated by LPS or LPS plus mIL-4 and specifying Sμ, Sγ1, Sγ3 and Cμ DNA (c), precipitated by Ab to 14-3-3 or AID. (d,e) ChIP assays involving chromatin from Aicda+/+ and Aicda−/− mouse B cells stimulated by LPS plus mIL-4 and Ab to 14-3-3, AID or PKA-Cα, and specifying (d) and quantifying Sμ, Sγ1, Sγ3 and Cμ DNA (e, data expressed as “fold enrichment” over DNA precipitated by irrelevant IgG, mean and s.d. of triplicate samples). (f) Two-step ChIP assays involving chromatin from Aicda+/+ and Aicda−/− mouse B cells stimulated by LPS plus mIL-4 and sequential precipitation by Abs to 14-3-3 and AID (left), or Abs to AID and 14-3-3 (middle), or Abs to 14-3-3 and PKA-Cα (right). Quantified Sμ and Sγ1 DNA are expressed as fold enrichment over DNA precipitated by irrelevant IgG used in the second immunoprecipitation step (mean and s.d. of triplicate samples).
Figure 3
Figure 3
14-3-3 proteins are upregulated in germinal center B cells and in B cells undergoing CSR in vitro. (a) Immunohistochemistry of serial human tonsil sections stained with Ab to 14-3-3, AID or BCL6 (brown signals) or no Ab (“Nil”, showing blue signals from the hematoxylin counterstaining). Scale bar: 50 μm. (b) Expression of AID and 14-3-3 in sorted tonsil IgD+ CD38 CD19+ naive and IgD CD38+ CD19+ germinal center B cells. (c) Expression of AID and 14-3-3 in sorted spleen PNAlo B220+ non-germinal center B cells and PNAhi B220+ germinal center B cells from NP16–CGG-immunized C57BL/6 mice. (d) Expression of 14-3-3 and AID in germinal centers (green, as stained by FITC-conjugated PNA) in serial spleen sections of C57BL/6 mice immunized with NP16–CGG for 7 d (one representative of four experiments). The magnified yellow-boxed area shows co-expression of 14-3-3 and AID in germinal center B cells (3 representative cells are indicated by arrowheads). Scale bar: 50 μm. (e,f) Immunoblotting (e) and RT-PCR (f) analysis of AID and the seven 14-3-3 isoforms in freshly isolated mouse primary B cells (d 0) or B cells after stimulation by mCD154 or LPS plus mIL-4. (g and h) Expression of 14-3-3 and AID in the whole cell, cytoplasm and nucleus of human 4B6 B cells (g) and mouse primary B cells stimulated by LPS plus mIL-4 for 60 h (h).
Figure 4
Figure 4
Blocking 14-3-3 by difopein inhibits 14-3-3 binding to 5′-AGCT-3′ repeats and hampers the binding of 14-3-3 and AID to S regions. (a) Flow cytometry analysis of the proportion (GFP+) of human 4B6 and 2E2 B cells expressing nil (gray shade), or GFP or GFP–difopein by lentivirus transduction. (b) Expression of 14-3-3 (all isoforms), AID and PCNA in 4B6 B cells and in mAb to hCD40 plus hIL-4-stimulated 2E2 B cells expressing nil, or GFP or GFP–difopein. (c) EMSA analysis of the binding to the [5′-AGCT-3′]3–24 bp oligonucleotide by two-fold increasing amounts of nuclear extracts from 4B6 B cells and mAb to hCD40 plus hIL-4-stimulated 2E2 B cells expressing GFP or GFP–difopein. Depicted are the quantified and normalized signals of complex A and A′ consisting of 14-3-3 and [5′-AGCT-3′]3–24 bp. (d) ChIP assays involving crosslinked chromatin from 4B6 B cells expressing GFP or GFP–difopein and Ab to 14-3-3 or AID, and specifying Sμ, Sγ1, Sα (Sα1/Sα2) and Cμ region DNA (left panels); and ChIP assays involving chromatin from 2E2 B cells expressing GFP or GFP–difopein after stimulation by mAb to hCD40 plus hIL-4, and specifying Sμ, Sγ1, Cμ and PAX5 DNA after precipitation by Ab to 14-3-3 or AID (right panels). DNA signals were quantified using ImageJ. Depicted is the percentage of input S region DNA precipitated by Ab to 14-3-3 or AID (mean and s.e.m. of three independent experiments).
Figure 5
Figure 5
Blocking 14-3-3 by difopein inhibits CSR in human and mouse B cells. (a,b) Human 4B6 and 2E2 B cells expressing GFP or GFP–difopein were analyzed for live B cell counts (proliferation) over a 5-d culture (panels [i]), viability (7–AAD, panels [ii]), levels of AICDA, mature VHDJH-Cμ, germline transcripts, circle transcripts and mature post-recombination transcripts by real-time qRT-PCR (panels [iii], data are normalized to the level of GAPDH transcripts and depicted as ratio of the expression in GFP–difopein-expressing B cells to that in GFP–expressing B cells, mean and s.d. of triplicate samples), and surface IgA (4B6 B cells) or IgG1 (2E2 B cells) expression (panels [iv], one representative of four independent experiments). (c) Purified mouse primary B cells transduced with pTAC–GFP or pTAC–GFP–difopein retrovirus and then stimulated by LPS plus mIL-4 were analyzed for the proportion (GFP+), number and viability of B cells expressing GFP or GFP–difopein (panels [i] and [ii]), expression of Aicda, mature VJ558DJH-Cμ transcripts, germline transcripts, circle Iγ1-Cμ and post-recombination Iμ-Cγ1 transcripts by real-time qRT-PCR and that of circle Iε-Cμ and post-recombination Iμ-Cε transcripts by semi-quantitative RT-PCR (panels [iii], data are normalized to the level of Gapdh transcripts and depicted as ratio of the expression in pTAC–GFP–difopein-transduced B cells to that in pTAC–GFP–transduced B cells, mean and s.d. of triplicate samples), and surface IgG1 expression (panel [iv], one representative of three experiments). **, p < 0.05; ***, p < 0.01.
Figure 6
Figure 6
14-3-3γ deficiency impaired CSR in mouse primary B cells. (a,b) Flow cytometry analysis of viability of 14-3-3γ+/+ and 14-3-3γ−/− B cells (B220+) from bone marrow, spleen and lymph nodes (a), and spleen B cells after stimulation by mCD154 or LPS plus mIL-4, or LPS alone (b). (c) Flow cytometry analysis of CSR in 14-3-3γ+/+ and 14-3-3γ−/− B cells (one representative of three experiments). The mean and s.e.m. of CSR to each Ig isotype in 14-3-3γ+/+ vs 14-3-3γ−/− B cells were as follows: mCD154/mIL-4-induced CSR to IgG1, 22.5±2.7% vs 10.2±0.5%; LPS/mIL-4-induced CSR to IgG1, 39.8±4.1% vs 15.2±4.3%; LPS-induced CSR to IgG3, 7.4±0.6% vs 3.4%±0.7%; and LPS, TGF-β, mIL-4 plus anti–IgD–dextran-induced CSR to IgA, 9.5±2.7% vs 4.1±0.8%. (d) Flow cytometry analysis of CFSE intensity and surface IgG1 expression in 14-3-3γ+/+ and 14-3-3γ−/− B cells labeled with CFSE and stimulated by mCD154 or LPS plus mIL-4 for 4 d (left panels). Proportion of B cells completing each cell division (proliferation) and the proportion of surface IgG1+ B cells at each cell division are depicted (right panels). (e) RT-PCR analysis of germline IH-CH, circle IH-Cμ and post-recombination Iμ-CH transcripts in 14-3-3γ+/+ and 14-3-3γ−/− B cells stimulated by LPS plus mIL-4, LPS, or LPS, TGF-β, mIL-4 plus anti–IgD–dextran. Nil: PCR reactions without DNA templates. (f) ChIP assays involving chromatin from 14-3-3γ+/+ and 14-3-3γ−/− B cells after stimulation by LPS plus mIL-4 for 60 h and Ab to 14-3-3γ, AID or PKA-Cα, and quantifying Sμ and Sγ1 DNA (expressed as fold enrichment over DNA precipitated by irrelevant IgG, mean and s.d. of triplicate samples).
Figure 7
Figure 7
14-3-3σ Er DN mutant impaired CSR in mouse primary B cells. (a,b) Flow cytometry analysis of viability of 14-3-3σ+/+ and 14-3-3σ+/Er B cells (B220+) from bone marrow, spleen and lymph nodes (a), and spleen B cells after stimulation by mCD154 or LPS plus mIL-4, or LPS alone (b). (c) Flow cytometry analysis of CSR in 14-3-3σ+/+ and 14-3-3σ+/Er B cells (one representative of three experiments). The mean and s.e.m. of CSR to each Ig isotype in 14-3-3σ+/+ vs 14-3-3σ+/Er B cells were as follows: mCD154/mIL-4-induced CSR to IgG1, 10.3±1.9% vs 6.0±1.8%; LPS/mIL-4-induced CSR to IgG1, 17.5±2.1% vs 7.2±1.3%; LPS-induced CSR to IgG3, 5.4±0.2% vs 2.4%±0.5%; and LPS, TGF-β, mIL-4 plus anti–IgD–dextran-induced CSR to IgA, 11.5±2.7% vs 5.8±1.9%. (d) Flow cytometry analysis of CFSE intensity and surface IgG1 expression in 14-3-3σ+/+ and 14-3-3σ+/Er B cells labeled with CFSE and stimulated by mCD154 or LPS plus mIL-4 for 4 d (left panels). Proportion of B cells completing each cell division (proliferation) and the proportion of surface IgG1+ B cells at each cell division are depicted (right panels). (e) RT-PCR analysis of germline IH-CH, circle IH-Cμ and post-recombination Iμ-CH transcripts in 14-3-3σ+/+ and 14-3-3σ+/Er B cells stimulated by LPS plus mIL-4, LPS, or LPS, TGF-β, mIL-4 plus anti–IgD–dextran. (f) ChIP assays involving chromatin from 14-3-3σ+/+ and 14-3-3σ+/Er B cells after stimulation by LPS plus mIL-4 for 60 h and Ab to 14-3-3σ, AID or PKA-Cα, and quantifying Sμ and Sγ1 DNA (expressed as fold enrichment over DNA precipitated by irrelevant IgG, mean and s.d. of triplicate samples).
Figure 8
Figure 8
14-3-3 adaptors interact directly with AID. (a) Immunoprecipitation of human 4B6 B cell lysates by rabbit Ab to 14-3-3 followed by immunoblotting with mouse mAb to AID or Mre11 (left); and pull-down of 14-3-3 with AID double-tagged with His10–Flag2 by Ni-NTA-conjugated agarose beads (right). (b) Immunoprecipitation of lysates of mouse primary B cells (stimulated by LPS plus mIL-4 for 48 h) by rabbit Ab to 14-3-3 followed by immunoblotting with mouse mAb to 14-3-3 or AID (left). Pre-treatment of lysates with DNase I yielded comparable results (right). (c) Schematics of the principle of the BiFC assay. (d) BiFC assays of the direct interaction of 14-3-3ζ and AID in HeLa cell nucleus, as revealed by fluorescence microscopy (also presented in Supplementary Fig. 7c). (e) BiFC assays of the direct interaction of 14-3-3ζ with PKA-Cα and AID, but not AIDΔ(190–198) or AIDΔ(180–198) in mouse CH12F3 B cells stimulated by LPS, mIL-4 plus TGF-β, as quantified by spectrofluorometry. (f) BiFC assays of the direct interaction of each of the seven 14-3-3 isoforms (fused to sEYFP155–238) with AID (fused to sEYFP1–154) in HeLa cells. Nil: co-expression of HA–sEYFP155–238 and Flag–sEYFP1–154, as analyzed by flow cytometry. (g) BiFC assays of the direct interaction of 14-3-3ζ with AID, but not AIDΔ(190–198) or AIDΔ(180–198) in HeLa cells (one representative of four experiments). (h) BiFC assays of the direct interaction of 14-3-3ζ with AID and AIDS38A in HeLa cells (one representative of four experiments).
Figure 9
Figure 9
14-3-3 adaptors enhance AID-mediated DNA deamination. (a) AID deaminated dC residues of Alexa Fluor 647-labeled [5′-AGCT-3′]3–24 nt in a dose-dependent fashion. Numbers below each lane indicate the percentage of DNA substrate showing deamination (sum of three cleavage products over the total input DNA). Lack of Ung in the reaction led to no cleavage products. (b) DNA deamination by sub-optimal amounts of AID in the presence of purified recombinant GST–14-3-3γ (top panel), GST–14-3-3σ (middle panel) and GST–14-3-3ζ (bottom panel). Numbers below each lane indicate the percentage of DNA substrate deaminated.

Similar articles

Cited by

References

    1. Maizels N. Immunoglobulin gene diversification. Annu Rev Genet. 2005;39:23–46. - PubMed
    1. Casali P. Somatic recombination and hypermutation in the immune system. In: Krebs JE, Goldstein ES, Kilpatrick ST, editors. Lewin's Genes X. Jones & Bartlett; Sudbury, MA: 2011. pp. 570–623.
    1. Odegard VH, Schatz DG. Targeting of somatic hypermutation. Nat Rev Immunol. 2006;6:573–583. - PubMed
    1. Casali P, Pal Z, Xu Z, Zan H. DNA repair in antibody somatic hypermutation. Trends Immunol. 2006;27:313–321. - PMC - PubMed
    1. Teng G, Papavasiliou FN. Immunoglobulin somatic hypermutation. Annu Rev Genet. 2007;41:107–120. - PubMed

Publication types

Substances