

Astrocytic gap junctional communication is reduced in amyloid-β-treated cultured astrocytes, but not in Alzheimer's disease transgenic mice
- PMID: 20730033
- PMCID: PMC2922840
- DOI: 10.1042/AN20100017
Astrocytic gap junctional communication is reduced in amyloid-β-treated cultured astrocytes, but not in Alzheimer's disease transgenic mice
Abstract
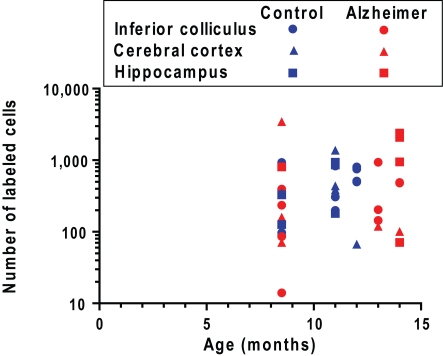
Alzheimer's disease is characterized by accumulation of amyloid deposits in brain, progressive cognitive deficits and reduced glucose utilization. Many consequences of the disease are attributed to neuronal dysfunction, but roles of astrocytes in its pathogenesis are not well understood. Astrocytes are extensively coupled via gap junctions, and abnormal trafficking of metabolites and signalling molecules within astrocytic syncytia could alter functional interactions among cells comprising the neurovascular unit. To evaluate the influence of amyloid-beta on astrocyte gap junctional communication, cultured astrocytes were treated with monomerized amyloid-β(1-40) (1 μmol/l) for intervals ranging from 2 h to 5 days, and the areas labelled by test compounds were determined by impaling a single astrocyte with a micropipette and diffusion of material into coupled cells. Amyloid-β-treated astrocytes had rapid, sustained 50-70% reductions in the area labelled by Lucifer Yellow, anionic Alexa Fluor® dyes and energy-related compounds, 6-NBDG (a fluorescent glucose analogue), NADH and NADPH. Amyloid-β treatment also caused a transient increase in oxidative stress. In striking contrast with these results, spreading of Lucifer Yellow within astrocytic networks in brain slices from three regions of 8.5-14-month-old control and transgenic Alzheimer's model mice was variable, labelling 10-2000 cells; there were no statistically significant differences in the number of dye-labelled cells among the groups or with age. Thus amyloid-induced dysfunction of gap junctional communication in cultured astrocytes does not reflect the maintenance of dye transfer through astrocytic syncytial networks in transgenic mice; the pathophysiology of Alzheimer's disease is not appropriately represented by the cell culture system.
Keywords: 6-NBDG, 6-[N-(7-nitrobenz-2-oxa-1,3-diazol-4-yl)amino]-6-deoxyglucose; A350, Alexa Fluor® 350; A568, Alexa Fluor® 568; APP, amyloid-β precursor protein; Cx, connexin; DCF, dichlorofluorescein; DMEM, Dulbecco's modified Eagle's medium; FBS, fetal bovine serum; GFAP, glial fibrillary acidic protein; H2DCF-DA, carboxydihydrodichlorofluorescein diacetate; L-LME, L-leucine methyl ester hydrochloride; ROS, reactive oxygen species; SR101, sulforhodamine 101; STZ, streptozotocin; aCSF, artificial cerebral spinal fluid; amyloid protein; astrocyte; connexin; dBcAMP, dibutyryl cAMP; dye transfer; gap junction; metabolite trafficking.
Figures


Similar articles
-
Hyperglycaemia and diabetes impair gap junctional communication among astrocytes.ASN Neuro. 2010 Mar 15;2(2):e00030. doi: 10.1042/AN20090048. ASN Neuro. 2010. PMID: 20396375 Free PMC article.
-
Selective astrocytic gap junctional trafficking of molecules involved in the glycolytic pathway: impact on cellular brain imaging.J Neurochem. 2009 Aug;110(3):857-69. doi: 10.1111/j.1471-4159.2009.06173.x. Epub 2009 May 15. J Neurochem. 2009. PMID: 19457076 Free PMC article.
-
Reduced gap junctional communication among astrocytes in experimental diabetes: contributions of altered connexin protein levels and oxidative-nitrosative modifications.J Neurosci Res. 2011 Dec;89(12):2052-67. doi: 10.1002/jnr.22663. Epub 2011 May 2. J Neurosci Res. 2011. PMID: 21567444 Free PMC article.
-
Astroglial Connexins as a Therapeutic Target for Alzheimer's Disease.Curr Pharm Des. 2017;23(33):4958-4968. doi: 10.2174/1381612823666171004151215. Curr Pharm Des. 2017. PMID: 28982320 Review.
-
Astrocyte adaptation in Alzheimer's disease: a focus on astrocytic P2X7R.Essays Biochem. 2023 Mar 3;67(1):119-130. doi: 10.1042/EBC20220079. Essays Biochem. 2023. PMID: 36449279 Free PMC article. Review.
Cited by
-
Astroglial connexins and cognition: memory formation or deterioration?Biosci Rep. 2020 Jan 31;40(1):BSR20193510. doi: 10.1042/BSR20193510. Biosci Rep. 2020. PMID: 31868207 Free PMC article. Review.
-
The role of the innate immune system in Alzheimer's disease and frontotemporal lobar degeneration: an eye on microglia.Clin Dev Immunol. 2013;2013:939786. doi: 10.1155/2013/939786. Epub 2013 Jul 18. Clin Dev Immunol. 2013. PMID: 23970926 Free PMC article. Review.
-
Altered Expression of Glial Gap Junction Proteins Cx43, Cx30, and Cx47 in the 5XFAD Model of Alzheimer's Disease.Front Neurosci. 2020 Oct 7;14:582934. doi: 10.3389/fnins.2020.582934. eCollection 2020. Front Neurosci. 2020. PMID: 33117125 Free PMC article.
-
Modification of astrocytic Cx43 hemichannel activity in animal models of AD: modulation by adenosine A2A receptors.Cell Mol Life Sci. 2023 Oct 29;80(11):340. doi: 10.1007/s00018-023-04983-6. Cell Mol Life Sci. 2023. PMID: 37898985 Free PMC article.
-
Amyloid-β regulates gap junction protein connexin 43 trafficking in cultured primary astrocytes.J Biol Chem. 2020 Oct 30;295(44):15097-15111. doi: 10.1074/jbc.RA120.013705. Epub 2020 Aug 31. J Biol Chem. 2020. PMID: 32868453 Free PMC article.
References
-
- Abe T, Takahashi S, Suzuki N. Oxidative metabolism in cultured rat astroglia: effects of reducing the glucose concentration in the culture medium and of d-aspartate or potassium stimulation. J Cereb Blood Flow Metab. 2006;26:153–160. - PubMed
-
- Abramov AY, Canevari L, Duchen MR. Calcium signals induced by amyloid β peptide and their consequences in neurons and astrocytes in culture. Biochim Biophys Acta. 2004;1742:81–87. - PubMed
-
- Alexander GE, Chen K, Pietrini P, Rapoport SI, Reiman EM. Longitudinal PET evaluation of cerebral metabolic decline in dementia: a potential outcome measure in Alzheimer's disease treatment studies. Am J Psychiatry. 2002;159:738–745. - PubMed
-
- Aller CB, Ehmann S, Gilman-Sachs A, Snyder AK. Flow cytometric analysis of glucose transport by rat brain cells. Cytometry. 1997;27:262–268. - PubMed
Publication types
MeSH terms
Substances
Grants and funding
LinkOut - more resources
Full Text Sources
Medical
Miscellaneous
