HCV+ hepatocytes induce human regulatory CD4+ T cells through the production of TGF-beta
- PMID: 20730048
- PMCID: PMC2921368
- DOI: 10.1371/journal.pone.0012154
HCV+ hepatocytes induce human regulatory CD4+ T cells through the production of TGF-beta
Abstract
Background: Hepatitis C Virus (HCV) is remarkably efficient at establishing persistent infection and is associated with the development of chronic liver disease. Impaired T cell responses facilitate and maintain persistent HCV infection. Importantly, CD4(+) regulatory T cells (Tregs) act by dampening antiviral T cell responses in HCV infection. The mechanism for induction and/or expansion of Tregs in HCV is unknown.
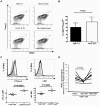
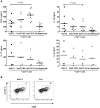
Methodology/principal findings: HCV-expressing hepatocytes were used to determine if hepatocytes are able to induce Tregs. The infected liver environment was modeled by establishing the co-culture of the human hepatoma cell line, Huh7.5, containing the full-length genome of HCV genotype 1a (Huh7.5-FL) with activated CD4(+) T cells. The production of IFN-gamma was diminished following co-culture with Huh7.5-FL as compared to controls. Notably, CD4(+) T cells in contact with Huh7.5-FL expressed an increased level of the Treg markers, CD25, Foxp3, CTLA-4 and LAP, and were able to suppress the proliferation of effector T cells. Importantly, HCV(+) hepatocytes upregulated the production of TGF-beta and blockade of TGF-beta abrogated Treg phenotype and function.
Conclusions/significance: These results demonstrate that HCV infected hepatocytes are capable of directly inducing Tregs development and may contribute to impaired host T cell responses.
Conflict of interest statement
Figures


Similar articles
-
HCV-infected hepatocytes drive CD4+ CD25+ Foxp3+ regulatory T-cell development through the Tim-3/Gal-9 pathway.Eur J Immunol. 2013 Feb;43(2):458-67. doi: 10.1002/eji.201242768. Epub 2012 Dec 23. Eur J Immunol. 2013. PMID: 23161469 Free PMC article.
-
Hepatitis C virus core protein triggers expansion and activation of CD4(+)CD25(+) regulatory T cells in chronic hepatitis C patients.Cell Mol Immunol. 2015 Nov;12(6):743-9. doi: 10.1038/cmi.2014.119. Epub 2014 Dec 22. Cell Mol Immunol. 2015. PMID: 25531392 Free PMC article.
-
Blockade of TGF-β signaling to enhance the antitumor response is accompanied by dysregulation of the functional activity of CD4+CD25+Foxp3+ and CD4+CD25-Foxp3+ T cells.J Transl Med. 2019 Jul 9;17(1):219. doi: 10.1186/s12967-019-1967-3. J Transl Med. 2019. PMID: 31288845 Free PMC article.
-
Modulation of Hepatitis C Virus-Specific CD8 Effector T-Cell Function with Antiviral Effect in Infectious Hepatitis C Virus Coculture Model.J Virol. 2017 Apr 28;91(10):e02129-16. doi: 10.1128/JVI.02129-16. Print 2017 May 15. J Virol. 2017. PMID: 28275182 Free PMC article.
-
Hepatocytes infected with hepatitis C virus change immunological features in the liver microenvironment.Clin Mol Hepatol. 2023 Jan;29(1):65-76. doi: 10.3350/cmh.2022.0032. Epub 2022 Aug 12. Clin Mol Hepatol. 2023. PMID: 35957546 Free PMC article. Review.
Cited by
-
Activation of the connective tissue growth factor (CTGF)-transforming growth factor β 1 (TGF-β 1) axis in hepatitis C virus-expressing hepatocytes.PLoS One. 2012;7(10):e46526. doi: 10.1371/journal.pone.0046526. Epub 2012 Oct 4. PLoS One. 2012. PMID: 23056332 Free PMC article.
-
Modulation of CD4⁺ T cell responses following splenectomy in hepatitis C virus-related liver cirrhosis.Clin Exp Immunol. 2011 Aug;165(2):243-50. doi: 10.1111/j.1365-2249.2011.04393.x. Epub 2011 May 25. Clin Exp Immunol. 2011. PMID: 21615390 Free PMC article.
-
Chimeric antigen receptor (CAR)-engineered T cells redirected against hepatitis C virus (HCV) E2 glycoprotein.Gut. 2016 Mar;65(3):512-23. doi: 10.1136/gutjnl-2014-308316. Epub 2015 Feb 6. Gut. 2016. PMID: 25661083 Free PMC article.
-
CD4+ primary T cells expressing HCV-core protein upregulate Foxp3 and IL-10, suppressing CD4 and CD8 T cells.PLoS One. 2014 Jan 20;9(1):e85191. doi: 10.1371/journal.pone.0085191. eCollection 2014. PLoS One. 2014. PMID: 24465502 Free PMC article.
-
HCV-infected hepatocytes drive CD4+ CD25+ Foxp3+ regulatory T-cell development through the Tim-3/Gal-9 pathway.Eur J Immunol. 2013 Feb;43(2):458-67. doi: 10.1002/eji.201242768. Epub 2012 Dec 23. Eur J Immunol. 2013. PMID: 23161469 Free PMC article.
References
-
- Erickson AL, Kimura Y, Igarashi S, Eichelberger J, Houghton M, et al. The outcome of hepatitis C virus infection is predicted by escape mutations in epitopes targeted by cytotoxic T lymphocytes. Immunity. 2001;15:883–895. - PubMed
Publication types
MeSH terms
Substances
Grants and funding
LinkOut - more resources
Full Text Sources
Other Literature Sources
Research Materials

