. 2010 Aug 12;6(8):e1001048.
doi: 10.1371/journal.ppat.1001048.

CTCF prevents the epigenetic drift of EBV latency promoter Qp

Affiliations

CTCF prevents the epigenetic drift of EBV latency promoter Qp

Italo Tempera et al. PLoS Pathog. .

Abstract

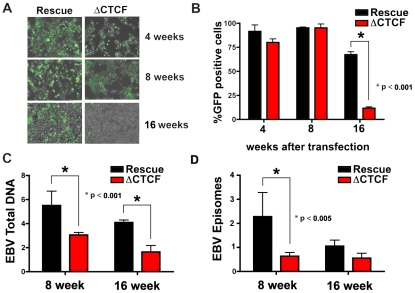
The establishment and maintenance of Epstein-Barr Virus (EBV) latent infection requires distinct viral gene expression programs. These gene expression programs, termed latency types, are determined largely by promoter selection, and controlled through the interplay between cell-type specific transcription factors, chromatin structure, and epigenetic modifications. We used a genome-wide chromatin-immunoprecipitation (ChIP) assay to identify epigenetic modifications that correlate with different latency types. We found that the chromatin insulator protein CTCF binds at several key regulatory nodes in the EBV genome and may compartmentalize epigenetic modifications across the viral genome. Highly enriched CTCF binding sites were identified at the promoter regions upstream of Cp, Wp, EBERs, and Qp. Since Qp is essential for long-term maintenance of viral genomes in type I latency and epithelial cell infections, we focused on the role of CTCF in regulating Qp. Purified CTCF bound approximately 40 bp upstream of the EBNA1 binding sites located at +10 bp relative to the transcriptional initiation site at Qp. Mutagenesis of the CTCF binding site in EBV bacmids resulted in a decrease in the recovery of stable hygromycin-resistant episomes in 293 cells. EBV lacking the Qp CTCF site showed a decrease in Qp transcription initiation and a corresponding increase in Cp and Fp promoter utilization at 8 weeks post-transfection. However, by 16 weeks post-transfection, bacmids lacking CTCF sites had no detectable Qp transcription and showed high levels of histone H3 K9 methylation and CpG DNA methylation at the Qp initiation site. These findings provide direct genetic evidence that CTCF functions as a chromatin insulator that prevents the promiscuous transcription of surrounding genes and blocks the epigenetic silencing of an essential promoter, Qp, during EBV latent infection.


Conflict of interest statement

The authors have declared that no competing interests exist.

Figures

Figure 1
Figure 1. EBV genome-wide analysis of histone and DNA methylation patterns in different latency types.
ChIP assays were performed with Mutu I (A–D), or Mutu-LCL (E–H) using antibodies for histone H3me2K4 (A and E), H3me3K9 (B and F), CTCF (C and G), or methyl cytosine (MeDIP) (D–H). ChIP DNA was assayed by real-time PCR using a genome wide array of 384 primers spaced ∼400 bp across the EBV genome. Approximate EBV genome positions are indicated in the schematic below each column of graphs. Graphs represent an average of three independent experiments. Standard deviation was less than 10 percent of the mean for all data points.
Figure 2
Figure 2. Analysis of epigenetic patterns in the EBV latency control region.
A–D) EBV genome-wide ChIP data from figure 1 was reanalyzed at EBV positions 1–60 kb as direct comparison between Mutu I (blue) and Mutu-LCL (red) for CTCF (panel A), methyl cytosine (panel B), H3me2K4 (panel C), H3me3K9 (panel D). E–G) Mutu I cells compared for CTCF (blue) vs methyl cytosine (red); CTCF (blue) vs H3me2K4 (green); CTCF (blue) vs H3me3K9 (yellow). H–J) Mutu-LCL-III cells compared for CTCF (blue) vs methyl cytosine (red); CTCF (blue) vs H3me2K4 (green); CTCF (blue) vs H3me3K9 (yellow).
Figure 3
Figure 3. Identification of a CTCF binding site upstream of Qp.
A) Schematic of CTCF and EBNA1 binding site organization at Qp, and the sequence of candidate CTCF binding sties (BS) 1 and 2. B) Coomassie stain of purified recombinant CTCF and EBNA1 proteins derived from baculovirus expression system. C) EMSA analysis of purified CTCF (10–100 ng) binding to DNA probes for EBV regions 49730–49768 (BS1), 49901–49939, or 50072–50113 (BS2). D) DNase I footprinting assay of purified CTCF protein (30–300 ng) in the absence (-) or addition (+) of 30 ng purified EBNA1, in buffer containing 150 mM (left panel) or 75 mM (right panel) NaCl.
Figure 4
Figure 4. Mutagenesis of CTCF binding site in Qp.
A) Schematic of mutations introduced into the Qp region of EBV bacmid. B) Purified bacmid DNA for EBV Wt, GAL K, Wt rescue, and ΔCTCF was analyzed by Sal I restriction digest and 0.7% agarose gel electrophoresis. DNA was visualized by ethidium bromide staining. C) PCR amplification of the region encompassing Qp for EBV Wt, GAL K, Wt rescue and ΔCTCF. D and E) ChIP assay of Wt rescue, or ΔCTCF bacmids in stable 293 cell pools after 8 weeks of hygromycin selection with antibody for CTCF (top panel), or EBNA1 (lower panel). CTCF ChIP was analyzed at Qp or a region −5 kb to Qp. EBNA1 ChIP was analyzed at Qp, or at OriLyt control region. E) Western blot analysis of CTCF, GFP, EBNA1, and PCNA protein levels for Wt rescue or ΔCTCF 293 cell pools.
Figure 5
Figure 5. CTCF binding site at Qp is required for stable maintenance of EBV episome in 293 cells.
A) Photomicrographs of GFP fluorescence of EBV bacmid Wt rescue or ΔCTCF in 293 cell pools after 4, 8 and 16 weeks post-transfection. B) EBV episome maintenance in Wt rescue or ΔCTCF 293 cell pools was assayed by FACS analysis as the percentage of GFP positive cells at the indicated weeks. Bars represent the average of three independent experiments. C) EBV genome copy number was assayed by real time PCR analysis in Wt rescue or ΔCTCF 293 cell pools at the indicated weeks. Bars represent the average of three independent experiments. D) Episomal viral DNA from Wt rescue or ΔCTCF 293 cell pools was isolated at the indicated weeks by Hirt extraction and assayed by quantitative real time PCR using the viral DNA from Raji cells as reference (ΔΔCt method). Bars represent the rate of episome lost of three independent experiments. All error bars indicate the standard deviation from the mean.
Figure 6
Figure 6. RNA expression and promoter utilization in Qp mutated bacmids.
A) Schematic representation of the EBV latency genes and promoters. Promoters are indicated by arrows. The position of the six EBNAs ORFs are indicated. B) Schematic representation of different EBNA1 transcripts. Exons present at 5′ end of EBNA1 mRNA are indicated in red. C) Quantitative RT-PCR was used to measure the abundance of EBNA2, EBNA3A and EBNA3C mRNA relative to bacmid GFP for Wt rescue or ΔCTCF bacmids in 293 cell pools at 4, 8, and 16 weeks after transfection, as indicated. D) Same as in C, except EBNA1-transcripts initiating from either Cp/Wp, Qp, or Fp were measured relative to GFP in Wt rescue or ΔCTCF bacmids in 293 cell pools at 4, 8, and 16 weeks after transfection. E) RT-PCR was measured for Wt rescue or ΔCTCF bacmids in 293 cell pools at 8 weeks post-transfection, as well as for type I (Mutu I) or type III (Mutu-LCL) controls. RNA was analyzed for the junction specific transcripts QUK (Qp initiation), C1C2W1W2 (Cp initiation), W0W1W2 (Wp initiation), BFLF1 (lytic gene adjacent to Qp), UK (EBNA1 mRNA in both type I and type III), and control cellular GAPDH.
Figure 7
Figure 7. Changes in epigenetic patterns in Qp mutated bacmids.
A) The epigenetic pattern of Qp region in Wt rescue and ΔCTCF bacmids in 293 cell pools was analyzed by MeDIP assay (A), H3me2K4 (B) and H3me3K9 (C) ChIp assay at 8 weeks (top panel) or 16 weeks (lower panel) after transfection. A schematic representation of Qp region is shown. D) Model of CTCF function in the chromatin organization at EBV Q promoter. CTCF is positioned as a barrier to the 5′ encroachment of H3me3K9 and mCpG in Wt rescue 293 cells (top panel). In ΔCTCF 293 cells, H3me2K4 is enriched throughout Qp and Fp at 8 weeks (lower panel, left), but is converted to H3me3K9 and mCpG at later times (16 weeks) (lower panel, right), indicating that CTCF is required to prevent this epigenetic drift at Qp.

Similar articles

Cited by

References

    1. Kieff E. Epstein-Barr Virus and its replication.; In: Fields BN, Knipe DM, Howley PM, editors. Philadelphia: Wolters Kluwer Health/Lippincott Williams & Wilkins; 2007. 2 v. (xix, 3091, 3086 p.) p.
    1. Rickinson AB, Kieff E. Epstein-Barr Virus.; In: Fields BN, Knipe DM, Howley PM, editors. Philadelphia: Wolters Kluwer Health/Lippincott Williams & Wilkins; 2007. 2 v. (xix, 3091, 3086 p.) p.
    1. Young LS, Rickinson AB. Epstein-Barr virus: 40 years on. Nat Rev Cancer. 2004;4:757–768. - PubMed
    1. Rowe M, Rowe DT, Gregory CD, Rickinson AB, et al. Differences in B-cell growth phenotype reflect novel patterns of Epstein-Barr virus latent gene expression in Burkitt's lymphoma cells. EMBO J. 1987;6:2743–2751. - PMC - PubMed
    1. Babcock GJ, Hochberg D, Thorley-Lawson AD. The expression pattern of Epstein-Barr virus latent genes in vivo is dependent upon the differentiation stage of the infected B cell. Immunity. 2000;13:497–506. - PubMed

Publication types

MeSH terms