

Understanding actions of others: the electrodynamics of the left and right hemispheres. A high-density EEG neuroimaging study
- PMID: 20730095
- PMCID: PMC2921336
- DOI: 10.1371/journal.pone.0012160
Understanding actions of others: the electrodynamics of the left and right hemispheres. A high-density EEG neuroimaging study
Abstract
Background: When we observe an individual performing a motor act (e.g. grasping a cup) we get two types of information on the basis of how the motor act is done and the context: what the agent is doing (i.e. grasping) and the intention underlying it (i.e. grasping for drinking). Here we examined the temporal dynamics of the brain activations that follow the observation of a motor act and underlie the observer's capacity to understand what the agent is doing and why.
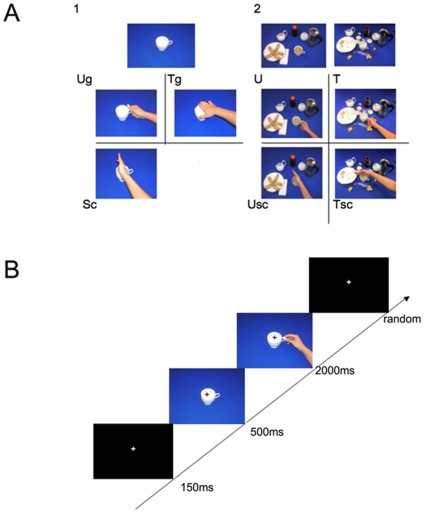
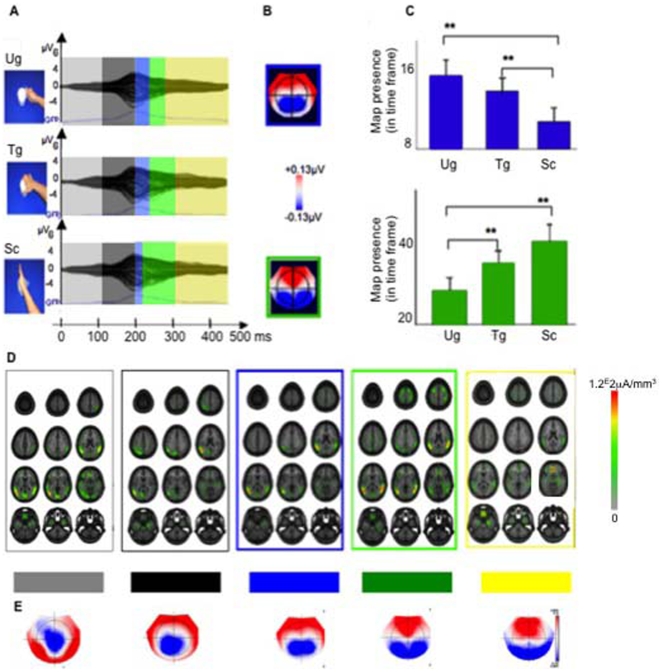
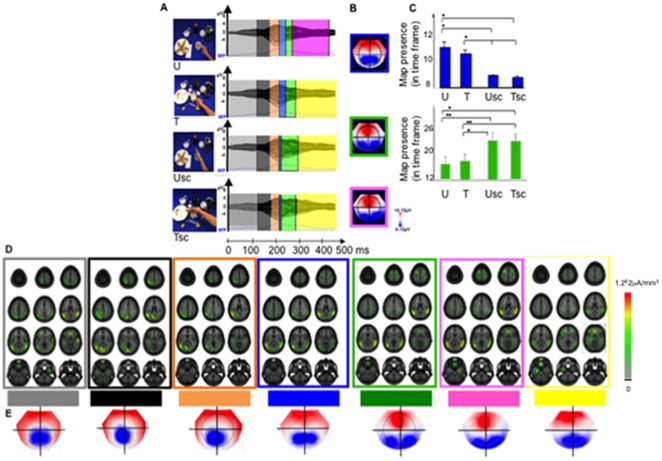
Methodology/principal findings: Volunteers were presented with two-frame video-clips. The first frame (T0) showed an object with or without context; the second frame (T1) showed a hand interacting with the object. The volunteers were instructed to understand the intention of the observed actions while their brain activity was recorded with a high-density 128-channel EEG system. Visual event-related potentials (VEPs) were recorded time-locked with the frame showing the hand-object interaction (T1). The data were analyzed by using electrical neuroimaging, which combines a cluster analysis performed on the group-averaged VEPs with the localization of the cortical sources that give rise to different spatio-temporal states of the global electrical field. Electrical neuroimaging results revealed four major steps: 1) bilateral posterior cortical activations; 2) a strong activation of the left posterior temporal and inferior parietal cortices with almost a complete disappearance of activations in the right hemisphere; 3) a significant increase of the activations of the right temporo-parietal region with simultaneously co-active left hemispheric sources, and 4) a significant global decrease of cortical activity accompanied by the appearance of activation of the orbito-frontal cortex.
Conclusions/significance: We conclude that the early striking left hemisphere involvement is due to the activation of a lateralized action-observation/action execution network. The activation of this lateralized network mediates the understanding of the goal of object-directed motor acts (mirror mechanism). The successive right hemisphere activation indicates that this hemisphere plays an important role in understanding the intention of others.
Conflict of interest statement
Figures
Similar articles
-
Parieto-frontal circuits during observation of hidden and visible motor acts in children. A high-density EEG source imaging study.Brain Topogr. 2014 Mar;27(2):258-70. doi: 10.1007/s10548-013-0314-x. Epub 2013 Sep 12. Brain Topogr. 2014. PMID: 24026809
-
Context and hand posture modulate the neural dynamics of tool-object perception.Neuropsychologia. 2013 Feb;51(3):506-19. doi: 10.1016/j.neuropsychologia.2012.12.003. Epub 2012 Dec 19. Neuropsychologia. 2013. PMID: 23261936
-
Self vs. other: neural correlates underlying agent identification based on unimodal auditory information as revealed by electrotomography (sLORETA).Neuroscience. 2014 Feb 14;259:25-34. doi: 10.1016/j.neuroscience.2013.11.042. Epub 2013 Dec 1. Neuroscience. 2014. PMID: 24295635
-
Functional anatomy of dominance for speech comprehension in left handers vs right handers.Neuroimage. 1998 Jul;8(1):1-16. doi: 10.1006/nimg.1998.0343. Neuroimage. 1998. PMID: 9698571 Review.
-
Grasping actions and social interaction: neural bases and anatomical circuitry in the monkey.Front Psychol. 2015 Jul 14;6:973. doi: 10.3389/fpsyg.2015.00973. eCollection 2015. Front Psychol. 2015. PMID: 26236258 Free PMC article. Review.
Cited by
-
Understanding and imitating unfamiliar actions: distinct underlying mechanisms.PLoS One. 2012;7(10):e46939. doi: 10.1371/journal.pone.0046939. Epub 2012 Oct 10. PLoS One. 2012. PMID: 23071668 Free PMC article. Clinical Trial.
-
Clocking the social mind by identifying mental processes in the IAT with electrical neuroimaging.Proc Natl Acad Sci U S A. 2016 Mar 8;113(10):2786-91. doi: 10.1073/pnas.1515828113. Epub 2016 Feb 22. Proc Natl Acad Sci U S A. 2016. PMID: 26903643 Free PMC article.
-
Pleasantness makes a good time: musical consonance shapes interpersonal synchronization in dyadic joint action.Front Hum Neurosci. 2024 Oct 22;18:1472632. doi: 10.3389/fnhum.2024.1472632. eCollection 2024. Front Hum Neurosci. 2024. PMID: 39502786 Free PMC article.
-
Weighted Brain Network Metrics for Decoding Action Intention Understanding Based on EEG.Front Hum Neurosci. 2020 Jul 2;14:232. doi: 10.3389/fnhum.2020.00232. eCollection 2020. Front Hum Neurosci. 2020. PMID: 32714168 Free PMC article.
-
Object words modulate the activity of the mirror neuron system during action imitation.Brain Behav. 2017 Sep 26;7(11):e00840. doi: 10.1002/brb3.840. eCollection 2017 Nov. Brain Behav. 2017. PMID: 29201543 Free PMC article.
References
-
- Hari R, Kujala MV. Brain basis of human social interaction: from concepts to brain imaging. Physiol Rev. 2009;89:453–479. - PubMed
-
- Gallese V, Rochat M, Cossu G, Sinigaglia C. Motor cognition and its role in the phylogeny and ontogeny of action understanding. Dev Psychol. 2009;45:103–113. - PubMed
-
- Rizzolatti G, Fabbri-Destro M, Cattaneo L. Mirror neurons and their clinical relevance. Nat Clin Pract Neurol. 2009;5:24–34. - PubMed
-
- Rizzolatti G, Fabbri-Destro M. Mirror neurons: from discovery to autism. Exp Brain Res 2009 - PubMed
-
- Carruthers P, Smith PK. Theories of theories of mind. Cambridge: Cambridge University Press; 1996.
