. 2010 Aug 13;5(8):e12153.
doi: 10.1371/journal.pone.0012153.

Cdc42 interaction with N-WASP and Toca-1 regulates membrane tubulation, vesicle formation and vesicle motility: implications for endocytosis

Affiliations

Cdc42 interaction with N-WASP and Toca-1 regulates membrane tubulation, vesicle formation and vesicle motility: implications for endocytosis

Wenyu Bu et al. PLoS One. .

Abstract

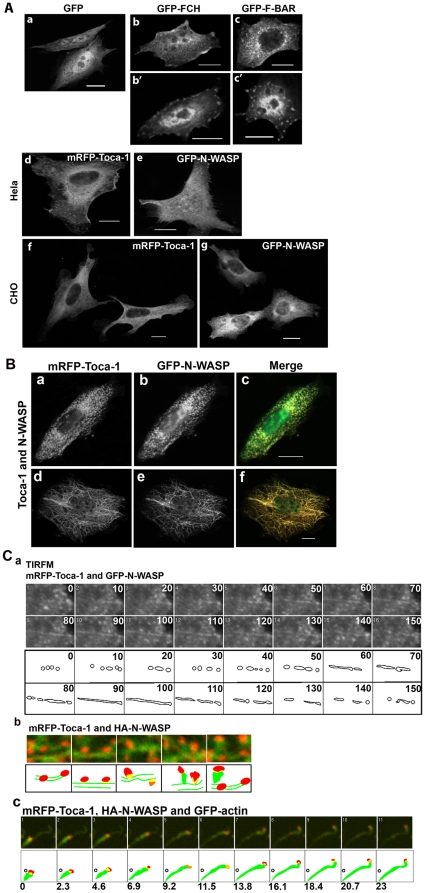
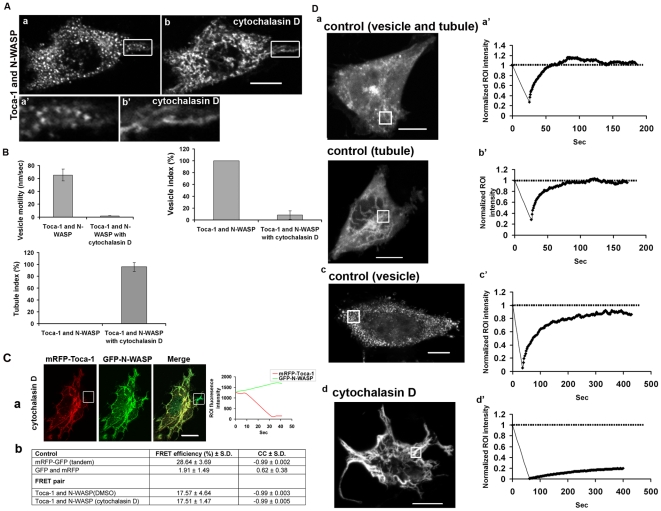
Transducer of Cdc42-dependent actin assembly (Toca-1) consists of an F-BAR domain, a Cdc42 binding site and an SH3 domain. Toca-1 interacts with N-WASP, an activator of actin nucleation that binds Cdc42. Cdc42 may play an important role in regulating Toca-1 and N-WASP functions. We report here that the cellular expression of Toca-1 and N-WASP induces membrane tubulation and the formation of motile vesicles. Marker and uptake analysis suggests that the tubules and vesicles are associated with clathrin-mediated endocytosis. Forster resonance energy transfer (FRET) and Fluorescence Lifetime Imaging Microscopy (FLIM) analysis shows that Cdc42, N-WASP and Toca-1 form a trimer complex on the membrane tubules and vesicles and that Cdc42 interaction with N-WASP is critical for complex formation. Modulation of Cdc42 interaction with Toca-1 and/or N-WASP affects membrane tubulation, vesicle formation and vesicle motility. Thus Cdc42 may influence endocytic membrane trafficking by regulating the formation and activity of the Toca-1/N-WASP complex.


Conflict of interest statement

Competing Interests: The authors have declared that no competing interests exist.

Figures

Figure 1
Figure 1. Characteristics of Toca-1/N-WASP induced membrane tubulation, vesicle formation and motility.
(A) Cells were transfected with cDNA encoding; GFP alone (panel a), GFP-FCH domain (panels b,b′), GFP-F-BAR domain (panels c,c′). mRFP-Toca-1 or GFP-N-WASP in HeLa cells (panels d,e). mRFP-Toca-1 or GFP-N-WASP in CHO cells (panels f,g). Toca-1 and N-WASP expressed individually induce filopodia formation as described in but not tubules or vesicles. (B–C) CHO cells were transfected with mRFP-Toca-1 and GFP-N-WASP (B, C part a) or with mRFP-Toca-1/HA-N-WASP and GFP-actin (C, parts b and c) as described in the Material and Methods section. (B) Confocal image of cells expressing mRFP-Toca-1-GFP-N-WASP. mRFP-Toca-1 (a and d), GFP-N-WASP (b and e) and the merge (c and f), green – N-WASP and red – Toca-1. Upper panels show vesicles (a–c) and lower panels (d–f) tubules. (C). TIRF live cell microscopy was used to follow the dynamics of tubule and membrane vesicle formation at the membrane (a). A time lapse sequence of mRFP-Toca-1 is shown with time in sec. The lower panels show a schematic of the time-lapse sequence illustrating how vesicles align to form tubules which then disassemble to give vesicles. (b) The process of vesicle formation from tubules is shown with mRFP-Toca-1 and GFP-actin as the two labels being followed. N-WASP is present but silent in HA tagged form. (c) mRFP-Toca/HA-N-WASP and GFP-actin were used to follow actin polymerization during vesicle motility. One vesicle was selected for analysis. Background signals were removed to allow clear visualization of the relationship between mRFP-Toca-1 and GFP-actin. Similar results were obtained with mRFP-N-WASP/myc-Toca-1 and GFP-actin. Bar = 10 µm. Movies S1, S2, S3 illustrate the dynamics of the Toca-1/N-WASP phenotype (see Suppl. data).
Figure 2
Figure 2. Effect of Toca-1 F-BAR mutants on Toca-1/N-WASP phenotypes.
Cells were transfected with mRFP-Toca-1 F-BAR mutants with N-WASP as outlined in the figures. (A). Phenotypes of Toca-1 F-BAR domain mutant/N-WASP combinations. (B) Motility of wild-type vesicles and Toca-1 F-BAR domain mutant generated vesicles. (C) FRAP analysis of Toca-1F-BAR domain mutant generated vesicles (a–d). Effect of Toca-1 F-BAR domain mutants on vesicle size (e) and motility (f). Bar = 10 µm. For statistical analysis numbers are averages +/− S. D., with n = 5–15, from 2-3 experiments.
Figure 3
Figure 3. Effect of Cyt. D on the Toca-1/N-WASP phenotypes.
(A). Cells were transfected with Toca-1 and N-WASP cDNA as described in the Material and methods sections. After 36 hr cells were chosen for either tubulation or membrane vesicle formation. Using time-lapse microscopy the change in phenotype was followed after addition of Cyt. D (4 µM) for 60 min. Panels show images at zero time (a, a′) and at 60 min (b, b′) of a representative cell. (a′b′) are enlargements of areas in panels a–b, respectively, showing (a′b′, Cyt. D) vesicle to tubule transitions. Bar = 10 µm. (B). Cells were then scored for presence of vesicles (vesicle index), tubules (tubule index) and vesicle motility as described in the Material and methods section. (C) Shows AP-FRET analysis of Toca-1/N-WASP in tubules or vesicles after Cyt. D treatment. (a) Images show typical cells used and the ROI. Green/red tracings show changes in intensity of the ROI before and after photobleaching. (b) A statistical analysis of FRET data with controls and FRET pairs. Bar = 10 µm. (D) FRAP analysis of the protein dynamics within the tubules/vesicles, with and without Cyt. D. Images show typical cells used and the graphs below show the bleach followed by the recovery profile. Time in sec. Bar = 10 µm. For statistical analysis numbers are averages +/− S. D., with n = 7–10, from 2–3 experiments.
Figure 4
Figure 4. FRET and FLIM analysis of the Toca-1/N-WASP interaction.
Cells were transfected with mRFP-Toca-1 and GFP-N-WASP cDNA and left to express mRFP/GFP for 36 hr as described in the Material and methods section. (A) Cells were selected for either a vesicle or tubule phenotype. ROIs focusing on these structures were chosen, as shown, and AP-FRET carried out as described in the Material and methods section. Green/red traces to the left of the cell images indicate mRFP/GFP fluorescence pre and post-bleach. The time course of these experiments is approx. 60 sec. (B) The Toca-1 SH3 domain mutant W518K (which is unable to bind N-WASP) was analyzed as shown for the wild-type in (A). (C) A summary of data obtained for controls as well as FRET pairs is shown. The CC shows the relationship between the mRFP and GFP signals during AP-FRET. GFP/mRFP FRET controls were as described in . For the positive FRET scenario we expect high negative cross correlation between donor and acceptor signals. We define positive FRET when the FRET efficiency (FE) >3% and CC >−0.7. (D) Cells are analyzed by frequency-domain FLIM as described in the Material and methods section. (a) Lifetimes are colour coded (between 1.0–3.0 ns). Cells were chosen as for AP-FRET for the presence of either tubules or vesicles and then 12 phase shifted images captured and processed to generate a lifetime image. (b) These images were processed to demonstrate more clearly morphological structures as follows; the higher lifetime signals (the non-interacting signals) from the original FLIM image were masked in Photoshop and then (using Metamorph) the masked image was given a pseudo color and overlaid with intensity image. Lifetime images are shown with the intensity images below. The lifetimes of GFP-N-WASP within tubules and vesicles can be obtained using this analysis. (c) Summary of lifetimes obtained for controls, N-WASP alone, Toca-1/N-WASP and Toca-1W518K/N-WASP. Bar = 10 µm. For statistical analysis numbers are averages +/− S. D., with n = 7–15, from 2–3 experiments.
Figure 5
Figure 5. Dynamin function, Toca-1 interaction and phenotype.
(A). Cells were transfected with mRFP-Toca-1 and either GFP-dynamin2 or GFP-dynamin1 cDNA (not shown) as described in the Material and methods. The top two panels show the cell phenotypes of individual protein expression. The lower two panels show the double expression with different level of protein expression. Bar = 10 µm. Numerical data are derived from AP-FRET analysis of mRFP-Toca-1/GFP-dynamin2. (B) mRFP-Toca-1, GFP-N-WASP and HA-dynamin transfections were carried as before (see figure 1 legend for details) and either dynamin1 WT (upper panel) or dynamin1-K44A (dominant negative) cDNA (lower panel). Three images for each combination is shown; Toca-1, N-WASP and merge (red – Toca-1; green – N-WASP). Single GFP/mRFP images are in black and white. Bar = 10 µm. For statistical analysis numbers are averages +/− S. D., with n = 8–10, from 2–3 experiments.
Figure 6
Figure 6. Cdc42, Toca-1 and N-WASP interactions and phenotypes.
(A) Cells were transfected Toca-1, N-WASP and Cdc42G12V and allowed to express for 36 hours as described in the Material and methods section. To perform AP-FRET Cdc42G12V was GFP labeled and the other cDNA labeled with mRFP. The third cDNA encoded (myc or HA tagged) non-fluorescent protein. Cells with either tubules or vesicles were then chosen and AP-FRET performed on the ROI. (a) Cdc42-Toca-1 interaction (panels 1–3 tubules, panels 4–6 vesicles). (b) Cdc42-N-WASP interaction (panels 1–3 tubules, panels 4–6 vesicles). (c) A statistical analysis of the AP-FRET data. Traces on the right of the images represent intensity values of GFP and mRFP during pre and post bleach. (B) AP-FRET analysis of interactions between Toca-1 and N-WASP mutants. Cells were transfected with cDNAs endcoding GFP and mRFP fusions and allowed to express for 36 hr as described in the Material and methods. (a) Top two panels show single transfections, either Toca-1-MGD383-385IST mutant alone or N-WASPH208D mutant alone. The subsequent 9 panels show, in groups of three; Toca-1MGD383-385-IST/N-WASP (panels 1–3), Toca-1/N-WASPH208D (panels 4–6) and Toca-1MGD383-385IST/N-WASPH208D (panels 7–9). Left panels show Toca-1 and mutants, middle panels show N-WASP and mutants and right panels show merged images. (b) A statistical analysis of the AP-FRET experiments with associated phenotypes. Bar = 10 µm. (C) Effect Toca-1/N-WASP and Toca-1/N-WASPΔWA combinations on F-actin as stained by phalloidin. (a) Cells were transfected with cDNAs encoding GFP-N-WASP and mRFP-Toca-1 fusions or (b) mRFP-Toca-1/GFP-N-WASPΔWA as described in the Material and methods. F-actin was visualized with phalloidin. In (a) first series of three images is a cell with tubules. Second series of three shows a cell with vesicles. (b) First series of three images shows signals from Toca1, N-WASPΔWA and then the merge. Second series of three shows N-WASPΔWA, F-actin and then the merge. Bar = 10 µm. For statistical analysis numbers are averages +/− S. D., with n = 7–10, from 2–3 experiments.
Figure 7
Figure 7. Effect of Toca-1MGD383-385IST and Cdc42 modulation on Toca-1/N-WASP phenotypes.
(A). Cells were transfected with cDNA encoding the Cdc42 binding mutant of Toca-1MGD383-385IST with N-WASP as described in the Material and methods. Cell phenotypes of Toca-1 MGD383-385IST with N-WASP were analyzed for (a) tubulation, (b) vesicle number and (c) vesicle motility. (B). Cells were transfected with cDNA encoding Toca-1/N-WASP, CRIB or GBD domains and effects on (a) tubulation, (b) vesicle number or (c) vesicle motility. (C). Cells were transfected with Toca-1/N-WASP/Cdc42 combinations and allowed to express for 36 hours as described in the Material and methods. (a) Effect of Cdc42G12V or Cdc42T17N on the Toca-1/N-WASP phenotype. (b) FRAP analysis of the protein dynamics of Cdc42G12V/Toca-1/N-WASP transfected cells. (c) Effect of N-WASPH208D exchange into Toca-1/N-WASP induced structures. Left panel – Toca-1 image, middle panel – N-WASPH208D image, right panel – merge of the two images. Bar charts show statistical analysis of effects N-WASPH208D exchange into the Toca-1/N-WASP complex on tubulation and on vesicle motility. The methods for measuring tubule index and vesicle motility are described in the Material and methods section. Bar = 10 µm. For statistical analysis numbers are averages +/− S. D., with n = 6–10, from 2–3 experiments.

Similar articles

Cited by

References

    1. Doherty GJ, McMahon HT. Mechanisms of endocytosis. Annu Rev Biochem. 2009;78:857–902. - PubMed
    1. Ellis S, Mellor H. Regulation of endocytic traffic by rho family GTPases. Trends Cell Biol. 2000;10:85–88. - PubMed
    1. Qualmann B, Mellor H. Regulation of endocytic traffic by Rho GTPases. Biochem J. 2003;371:233–241. - PMC - PubMed
    1. Ridley AJ. Rho GTPases and actin dynamics in membrane protrusions and vesicle trafficking. Trends Cell Biol. 2006;16:522–529. - PubMed
    1. Kroschewski R, Hall A, Mellman I. Cdc42 controls secretory and endocytic transport to the basolateral plasma membrane of MDCK cells. Nat Cell Biol. 1999;1:8–13. - PubMed

Publication types

MeSH terms