. 2010 Aug 11;5(8):e12103.
doi: 10.1371/journal.pone.0012103.

Tumorigenic WAP-T mouse mammary carcinoma cells: a model for a self-reproducing homeostatic cancer cell system

Affiliations

Tumorigenic WAP-T mouse mammary carcinoma cells: a model for a self-reproducing homeostatic cancer cell system

Florian Wegwitz et al. PLoS One. .

Abstract

Background: In analogy to normal stem cell differentiation, the current cancer stem cell (CSC) model presumes a hierarchical organization and an irreversible differentiation in tumor tissue. Accordingly, CSCs should comprise only a small subset of the tumor cells, which feeds tumor growth. However, some recent findings raised doubts on the general applicability of the CSC model and asked for its refinement.

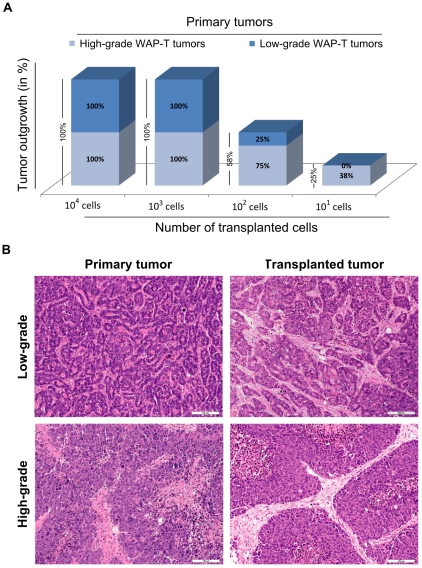
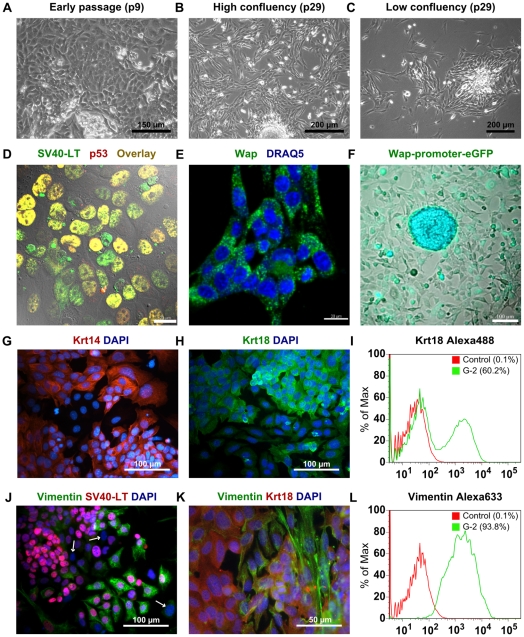
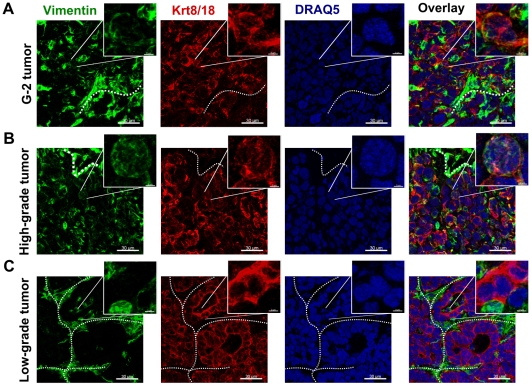
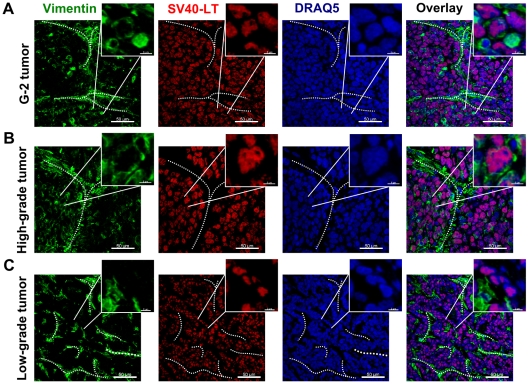
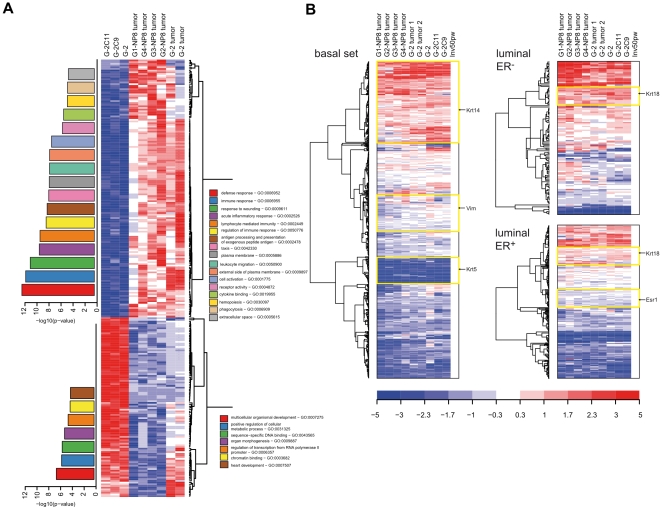
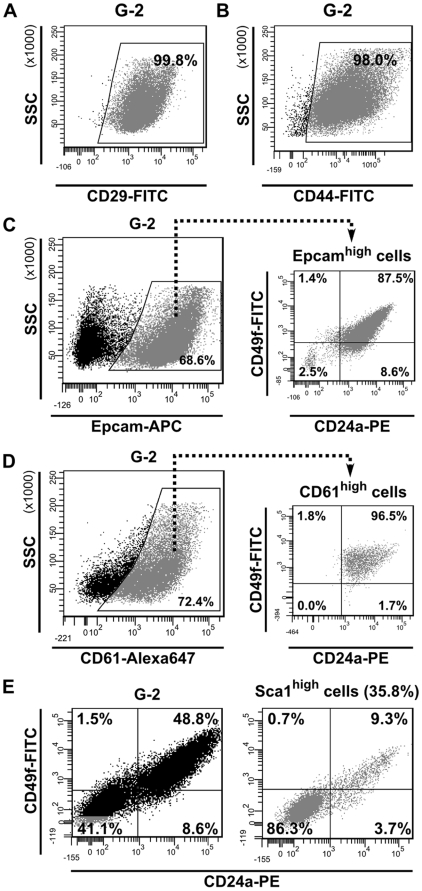
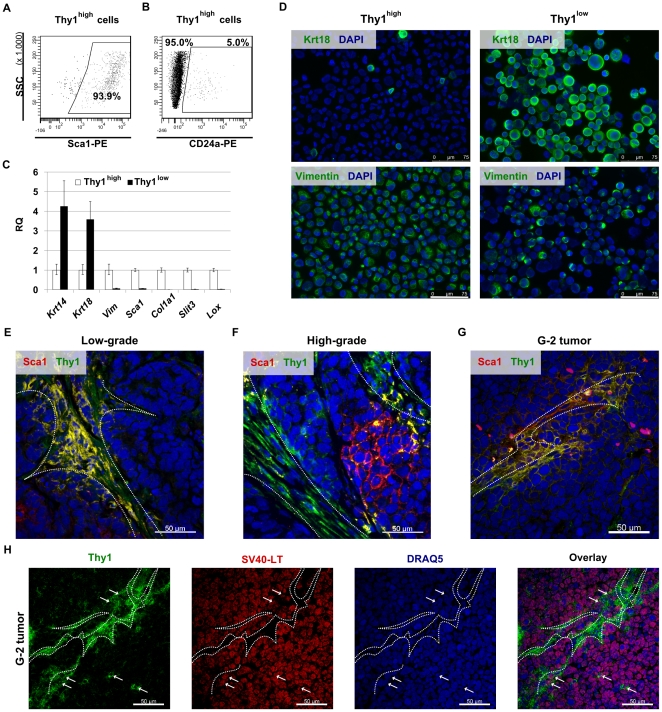
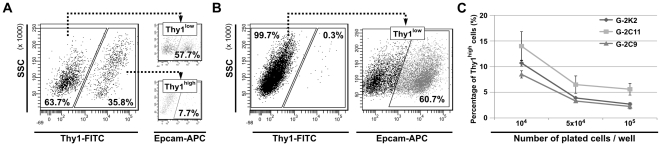
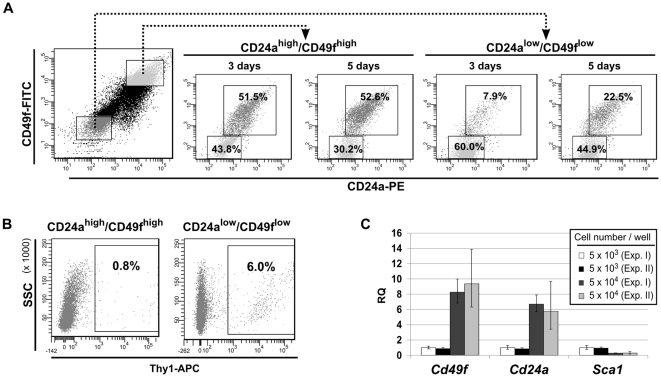
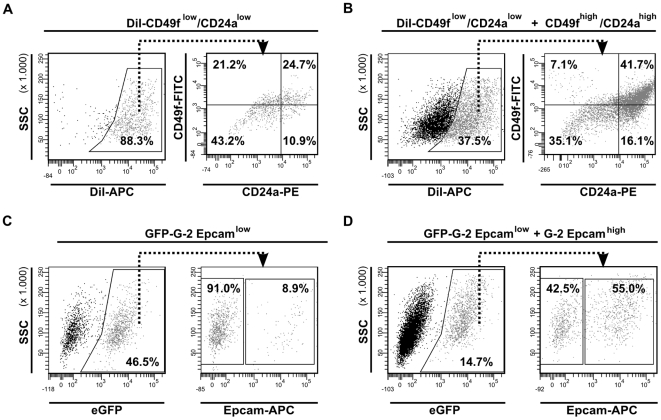
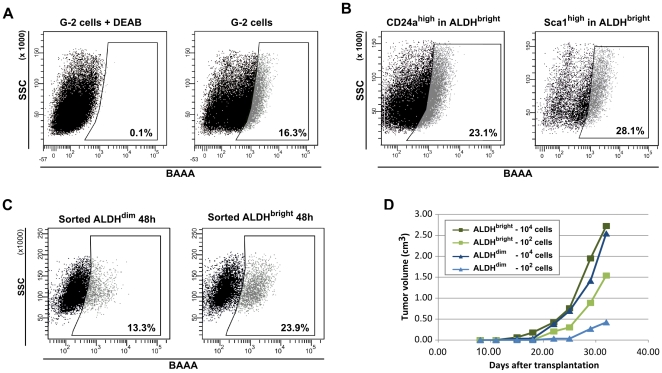
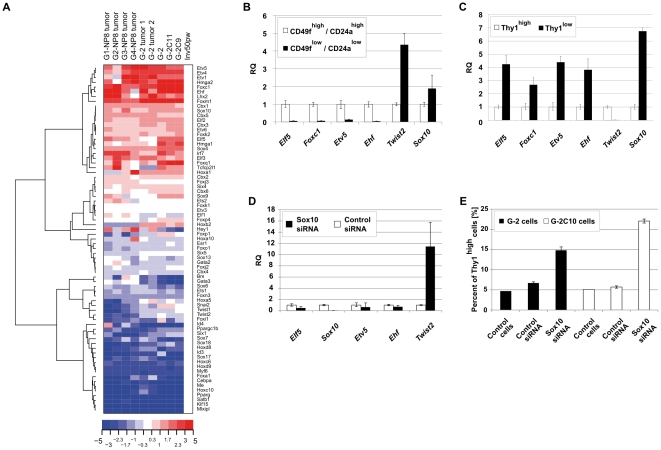
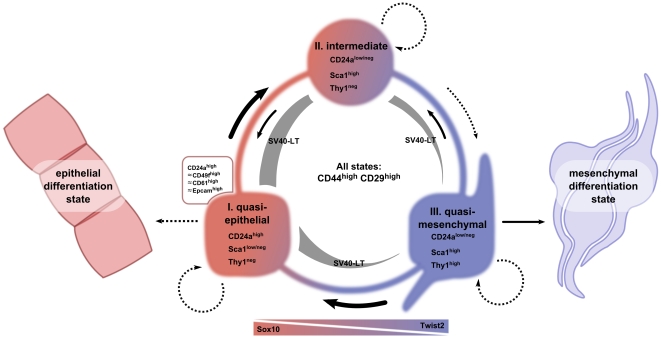
Methodology/principal findings: In this study we analyzed the CSC properties of mammary carcinoma cells derived from transgenic (WAP-T) mice. We established a highly tumorigenic WAP-T cell line (G-2 cells) that displays stem-like traits. G-2 cells, as well as their clonal derivates, are closely related to primary tumors regarding histology and gene expression profiles, and reflect heterogeneity regarding their differentiation states. G-2 cultures comprise cell populations in distinct differentiation states identified by co-expression of cytoskeletal proteins (cytokeratins and vimentin), a combination of cell surface markers and a set of transcription factors. Cellular subsets sorted according to expression of CD24a, CD49f, CD61, Epcam, Sca1, and Thy1 cell surface proteins, or metabolic markers (e.g. ALDH activity) are competent to reconstitute the initial cellular composition. Repopulation efficiency greatly varies between individual subsets and is influenced by interactions with the respective complementary G-2 cellular subset. The balance between differentiation states is regulated in part by the transcription factor Sox10, as depletion of Sox10 led to up-regulation of Twist2 and increased the proportion of Thy1-expressing cells representing cells in a self-renewable, reversible, quasi-mesenchymal differentiation state.

Conclusions/significance: G-2 cells constitute a self-reproducing cancer cell system, maintained by bi- and unidirectional conversion of complementary cellular subsets. Our work contributes to the current controversial discussion on the existence and nature of CSC and provides a basis for the incorporation of alternative hypotheses into the CSC model.


Conflict of interest statement

Competing Interests: The authors have declared that no competing interests exist.

Figures

Figure 1
Figure 1. Tumorigenic property of WAP-T tumor cells.
(A) Cells from high-grade WAP-T tumors are more tumorigenic than cells from low-grade tumors. Serially diluted (101, 102, 103, 104) freshly isolated WAP-T tumor cells were injected into the left abdominal mammary gland as described in Materialsand Methods . (B) H&E staining of low-grade and high-grade, respectively, WAP-T primary and their corresponding transplanted tumor. The transplanted tumors grew after injection of 104 or 102 cells, respectively, from low-grade and high-grade tumors. Scale bar: 100 µm.
Figure 2
Figure 2. Characterization of G-2 cells in cell culture.
(A–C) Phase-contrast images of G-2 cells in an early (p9) and a later (p29) passage. (D) Confocal image of G-2 cells stained with anti-SV40-LT (green) and anti-p53 (red) antibodies. Images were merged with a differential interference contrast (DIC) micrograph. (E) Confocal image of G-2 cells stained with anti-Wap (green) antibody. Nuclei were visualized by DRAQ5 staining (blue). (F) Live-cell fluorescence image of G-2 cells after lentiviral transduction with an eGFP reporter construct under control of the Wap-promoter. FACS-enriched eGFP+-cells were kept in culture for 2 weeks. (G and H) Keratin 14 (red) and keratin 18 (green) immunostaining of cultured G-2 cells. Nuclei were visualized by DAPI staining (blue). (I) FACS-based quantitation of keratin 18 expression in G-2 cells at passage 20. (J and K) Vimentin (green) and SV40-LT (red)/keratin 18 (red) co-staining of cultured G-2 cells at passage 10. Arrows mark G-2 cells without detectable SV40-LT expression. Nuclei were visualized by DAPI staining (blue). (L) FACS-based quantitation of vimentin expression in G-2 cells at passage 20. Scale bars: A: 150 µm; B and C: 200µm; D and E: 20 µm; F, G, H and J: 100 µm; K: 50µm.
Figure 3
Figure 3. Expression of the intermediate filament proteins in G-2 and WAP-T tumors.
(A–C) Representative confocal images of tumor-cryosections of a G-2 cell-derived tumor (A), and a high-grade (B) and a low-grade (C) endogenous WAP-T tumor stained with anti-vimentin (green) and anti-keratin 8/18 (red) antibodies. The nuclei were stained with DRAQ5 (blue). The power insets are used to display co-expression of vimentin and keratin 8/18 in G-2 and high-grade WAP-T tumors. The white dashed lines mark stromal structures. The confocal 3D-stacks were deconvoluted using Huygens Essential software and reconstructed with the Imaris software. Scale bar: main picture: 30 µm; magnification: 3 µm.
Figure 4
Figure 4. Expression of the intermediate filament protein vimentin and the SV40-LT transgene in G-2 and WAP-T tumors.
(A–C) Representative confocal images of tumor-cryosections of a G-2 cell-derived tumor (A), a high-grade (B) and a low-grade (C) endogenous WAP-T tumor stained with anti-vimentin (green) and anti-SV40-LT (red) antibodies. The nuclei were stained with DRAQ5 (blue). The power insets are used to display co-expression of vimentin and SV40-LT in G-2 and high-grade WAP-T tumors. The white dashed lines mark stromal structures. The confocal 3D-stacks were deconvoluted using Huygens Essential software and reconstructed with the Imaris software. Scale bar: main picture: 50 µm; magnification: 6 µm.
Figure 5
Figure 5. Expression of the cytokeratins in G-2 and WAP-T tumors.
(A–C) Representative confocal images of tumor-cryosections of a G-2 cell-derived tumor (A), a high-grade (B) and a low-grade (C) endogenous WAP-T tumor stained with anti-keratin 8/18 (green) and anti-keratin 14 (red) antibodies. The nuclei were stained with DRAQ5 (blue). The power insets are used to display co-expression of keratin 8/18 and keratin 14 in G-2, high-grade and low-grade WAP-T tumors. The confocal 3D-stacks were deconvoluted using Huygens Essential software and reconstructed with the Imaris software. Scale bar: main picture: 50 µm; magnification: 6 µm.
Figure 6
Figure 6. Gene expression profiling of G-2 cells and tumor samples.
(A) 250 genes differentially expressed in cultured G-2 cells and endogenous WAP-T or G-2 cell derived tumors (Table S1) were used to generate a heat map. Enriched GO categories are shown as bar diagrams corresponding to higher or lower expressed gene clusters in the respective sample group. Color-coding and the height of a bar represents the statistical significance (-log10(p-value)) of the observed enrichment of the respective GO categories. (B) Genes characteristic for luminal-ER+, luminal-ER, and basal/myoepithelial cells were used to generate heat maps. Gene expression data obtained for cell culture (G-2, G-2C9 and G-2C11 cells) and tumor samples (two G-2 transplanted tumors and four WAP-T-NP8 tumors representing four histological grades) were used for this analysis. Gene expression intensities of a mammary gland of a parous BALB/c mouse (50 days post weaning) were used as a reference. Prominent gene clusters (Krt14, Vim, Krt5, Krt18, and Esr1) are highlighted by yellow boxes. The expression values are color coded: red – high expression, blue – low expression.
Figure 7
Figure 7. Expression of stemness-related cell surface markers in G-2 cells.
(A, B) Representative FACS dot plots showing the expression of CD29 (A) and CD44 (B) in G-2 cultured cells. (C) Representative FACS dot plots showing the expression of Epcam (C, left) in cultured G-2 cells and the distribution of CD24a and CD49f (C, right) within the Epcamhigh cell population. (D) Representative FACS dot plots showing the expression of CD61 (D, left) in cultured G-2 cells and the distribution of CD24a and CD49f (C, right) within the CD61high cell population. (E) Representative FACS dot plots showing the expression of CD24a and CD49f in cultured G-2 cells (E, left) and within the Sca1high (E, right) cell population.
Figure 8
Figure 8. Properties of G-2 cell subsets differing in expression of Thy1.
(A, B) Representative FACS dot plots showing the expression of Sca1 (A) and CD24a (B) in the Thy1high population of cultured G-2 cells. (C) Relative quantitation of gene expression by real-time qPCR in the Thy1high and Thy1low subsets. Each assay was done in triplicate and raw RQ values were calculated by normalizing to the Gapdh gene. The Thy1high subset was selected as calibrator. (D) Cytospin preparations of FACS-sorted Thy1high and Thy1low G-2 cells were stained for keratin 18 (D, upper panels) and vimentin (D, lower panels). (E, F, G) Representative confocal images of a low-grade (E) and a high-grade (F) WAP-T tumors as well as of a G-2 (G) tumor. Cryosections of tumor samples were stained with anti-Thy1 (green) and anti-Sca1 (red) antibodies. (H) Representative confocal image showing expression of Thy1 (green) and SV40-LT (red) in G-2 tumor. Individual color channels are shown. Arrows mark the cells co-expressing Thy1 and SV40-LT. Nuclei were stained with DAPI (D) or DRAQ5 (E, F, G, H). The white dashed lines mark stromal structures. Confocal 3D-stacks were deconvoluted using Huygens Essential software and reconstructed with the Imaris software. Scale bar: D: 75 µm; E, F, G and H: 50 µm.
Figure 9
Figure 9. Repopulation activity of the Thy1high/low G-2 cell subsets.
(A, B) Repopulation activity of the Thy1low and Thy1high subsets. FACS-sorted Thy1high (A) and Thy1low (B) G-2 cells were cultured for 5 days in 6-well plates and re-analyzed by FACS for Thy1 expression (A, left; B, left). The distribution of Epcam within the respective Thy1high and Thy1low subsets was then determined by further FACS-analysis (A, B, right panels). (C) Cells of the G-2 derived clones K2, C9 and C11 were plated at low (1×10⁴), intermediate (5×10⁴) and high (1×10⁵) density in 6-well plates and analyzed 2 days later for Thy1 expression by FACS (n = 3). The representative FACS dot plots are shown.
Figure 10
Figure 10. Repopulation activity of G-2 cell subsets differing in expression of CD24a/CD49f.
(A) Repopulation activity of G-2 cell subsets differing in expression of CD24a and CD49f. CD24ahigh/CD49fhigh and CD24alow/CD49flow subsets were gated to exclude any overlap (left FACS dot plot). 5×10⁴ sorted cells were transferred back into culture (6-well plates) and the composition of the cell culture was re-analyzed for the same markers 3 and 5 days later by FACS. Note that in the resulting four FACS dot plots the gates of CD24alow/CD49flow cells are restricted by the magnification. The percentages of events in each gate (quadrant) are given. (B) 5×10⁴ sorted CD24ahigh/CD49fhigh and CD24alow/CD49flow G-2 cells were transferred back into culture (6-well plates) and analyzed 5 days later for expression of Thy1 by FACS. The representative FACS dot plots are shown. (C) The CD24alow/CD49flow subset was sorted and plated at low (5×10³ cells per well) and high (5×10⁴ cells per well) density in 6-well plates. After 5 days in culture, expression of Cd49f, Cd24a, and Sca1 was quantitated by real-time qPCR. The experiment was performed in duplicate and repeated twice.
Figure 11
Figure 11. Repopulation activity of G-2 cell subsets depends on cellular interactions.
(A, B) CD24alow/CD49flow cells were labeled with DiI and 1×10⁴ labeled cells were either cultured separately (A), or plated at a 1∶1 ratio with non-labeled CD24ahigh/CD49fhigh cells (B) in 6-well plates. After 3 days in culture, DiI labeled cells were analyzed for expression of CD24a and CD49f by FACS. (C, D) 1×10⁴ cells of the Epcamlow subset expressing eGFP were either cultured alone (C) or plated at a 1∶1 ratio with G-2 cells lacking eGFP from the Epcamhigh subset (D) in 6-well plates. After 3 days in culture, GFP positive cells were analyzed for Epcam expression by FACS. The representative FACS dot plots are shown.
Figure 12
Figure 12. Properties of G-2 cell subsets differing in aldehyde dehydrogenase activity.
(A) Representative FACS dot plots showing ALDH activity of G-2 cells (A, right panel) measured with the Aldefluor reagent (BAAA). To define the ALDHbright gate, G-2 cells were stained with the Aldefluor reagent in presence of the ALDH inhibitor DEAB (A, left panel). (B) Representative FACS dot plots showing the expression of CD24a (B, left panel) and Sca1 (B, right panel) in the ALDHbright subsets. Fluorescence-values of the Aldefluor-channel (FITC) and the CD24a-channel (PE) were compensated before analysis of the CD24ahigh and Sca1high fluorescence. (C) Repopulation activity of the ALDHbright and ALDHdim subsets. 5×10⁵ FACS-sorted ALDHbright and ALDHdim cells were individually plated in 6-well plates. After 2 days in the culture, cells were analyzed for ALDH activity by Aldefluor staining and FACS. (D) The graph shows growth curves of tumors arising upon transplantation of ALDHbright and ALDHdim G-2 cells into the left abdominal mammary gland of virgin syngeneic mice (WAP-T-NP8). The dark and light curves, respectively, represent tumor growth kinetics of 104 and 102 transplanted cells in individual recipient mice.
Figure 13
Figure 13. Expression of selected transcription factors in G-2 cells.
(A) Hierarchical cluster analysis of microarray gene expression data. 73 genes coding for transcription factors (Table S1) were selected to generate a heat map. Gene expression log2-ratios are displayed with gene expression intensities of the mammary gland of a parous BALB/c mouse (50 days post weaning; Inv50pw) serving as reference. The relative expression values are color coded: red – high expression, blue – low. (B–D) Relative quantitation of gene expression by real-time qPCR in CD24ahigh/CD49fhigh and CD24alow/CD49flow (B), Thy1high and Thy1low (C) G-2 cell subsets, and G-2 cells transfected with Sox10 or control siRNA (D), respectively. Each assay was done in triplicate, and raw RQ values were calculated by normalizing to the Gapdh gene. (E) siRNA-mediated Sox10 depletion increases the number of Thy1-expressing cells. G-2 and G-2C10 cells were transfected with Sox10 or control siRNA and were analyzed for Thy1 expression by FACS after 5 days culture. A representative analysis is shown.
Figure 14
Figure 14. Schematic overview of the G-2 “cancer cell system”.
The cellular composition of the assumed G-2 cancer cell system is determined by three interconvertible differentiation states: quasi-epithelial, intermediate, and quasi-mesenchymal. These states are characterized by the expression of a combination of cell surface associated proteins (CD24a, CD49f, CD61, Epcam, Sca1, Thy1), a specific set of transcription factors and by their cytoskeletal composition (Krt14, Krt18, vimentin), as well as by their ability to self-renew. Cells in all three states express the CD44 and CD29 proteins on their surfaces. The existence of the (self-sustaining) G-2 system depends on the expression SV40 LT, driven by the WAP-promoter, which is under control of epithelial transcription factors (TFs). Shut off of epithelial TFs leads to loss of SV40 LT expression and irreversible transition to a completely mesenchymal differentiation state. The existence of an irreversible epithelial differentiation state has not been proven, however, cannot be excluded. Transition rates between differentiation states and self-reproduction are determined by kinetic parameters which depend on intercellular communications and/or autocrine/paracrine factors as well as on the activity of the inversely expressed transcription factors (e.g. Sox10 and Twist2). The variable width of arrows should illustrate the observed differences in rates of transitions, e.g. the transition into quasi-mesenchymal is a rare (unfavorable) event, whereas the reverse transition readily takes place in culture. The figure was drawn using an open-source vector graphics program Inkscape.

Similar articles

Cited by

References

    1. Rubin H. Ordered heterogeneity and its decline in cancer and aging. Adv Cancer Res. 2007;98:117–147. - PubMed
    1. Dick JE. Stem cell concepts renew cancer research. Blood. 2008;112:4793–4807. - PubMed
    1. Ward RJ, Dirks PB. Cancer Stem Cells: At the Headwaters of Tumor Development. Annu Rev Pathol. 2007;2:175–189. - PubMed
    1. Lobo NA, Shimono Y, Qian D, Clarke MF. The biology of cancer stem cells. Annu Rev Cell Dev Biol. 2007;23:675–699. - PubMed
    1. Nowell PC. Mechanisms of tumor progression. Cancer Res. 1986;46:2203–2207. - PubMed

Publication types

MeSH terms