Review
. 2011 Mar-Apr;3(2):167-82.
doi: 10.1002/wsbm.108. Epub 2010 Aug 20.

Live cell imaging and systems biology

Affiliations
Review

Live cell imaging and systems biology

Myong-Hee Sung et al. Wiley Interdiscip Rev Syst Biol Med. 2011 Mar-Apr.

Abstract

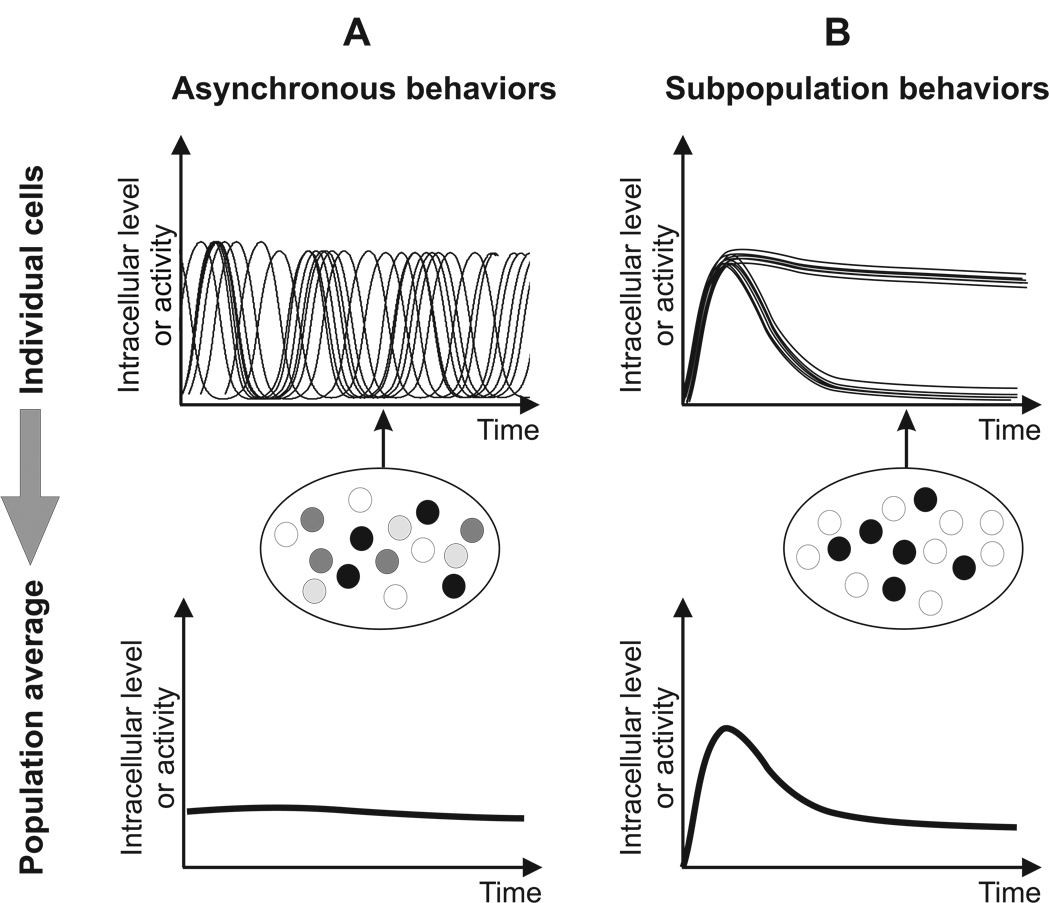
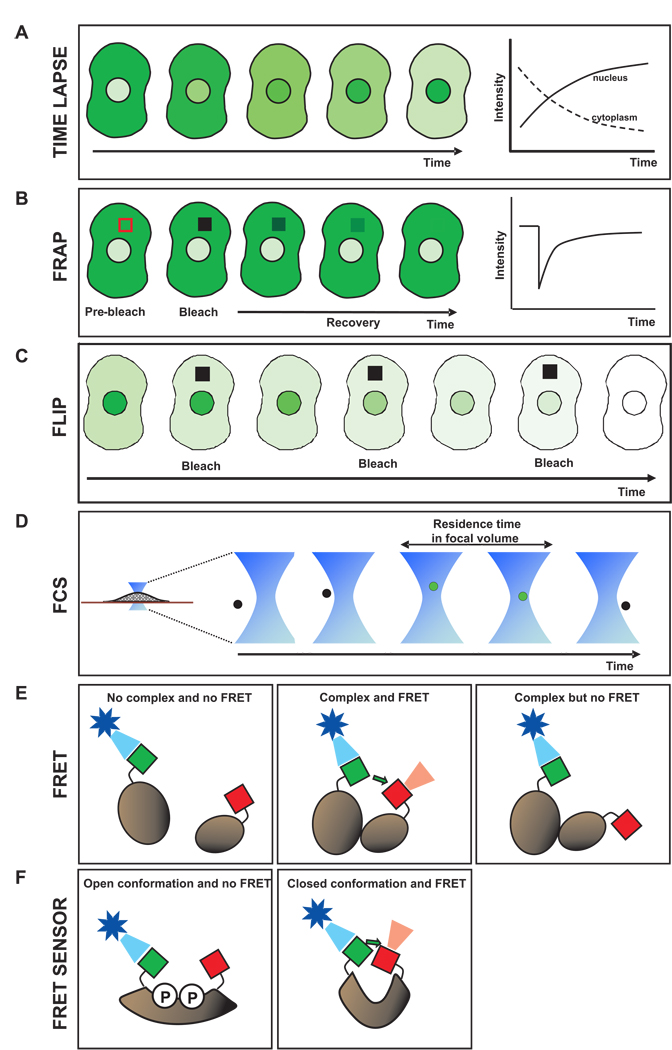
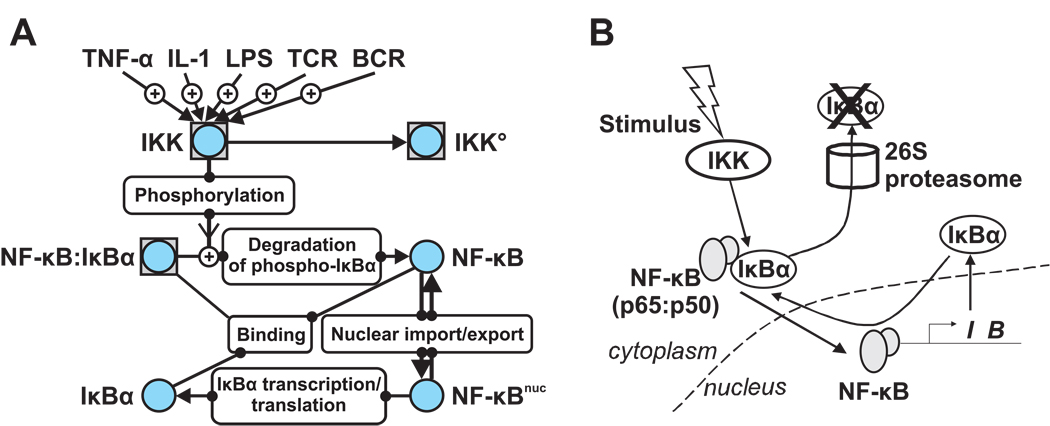
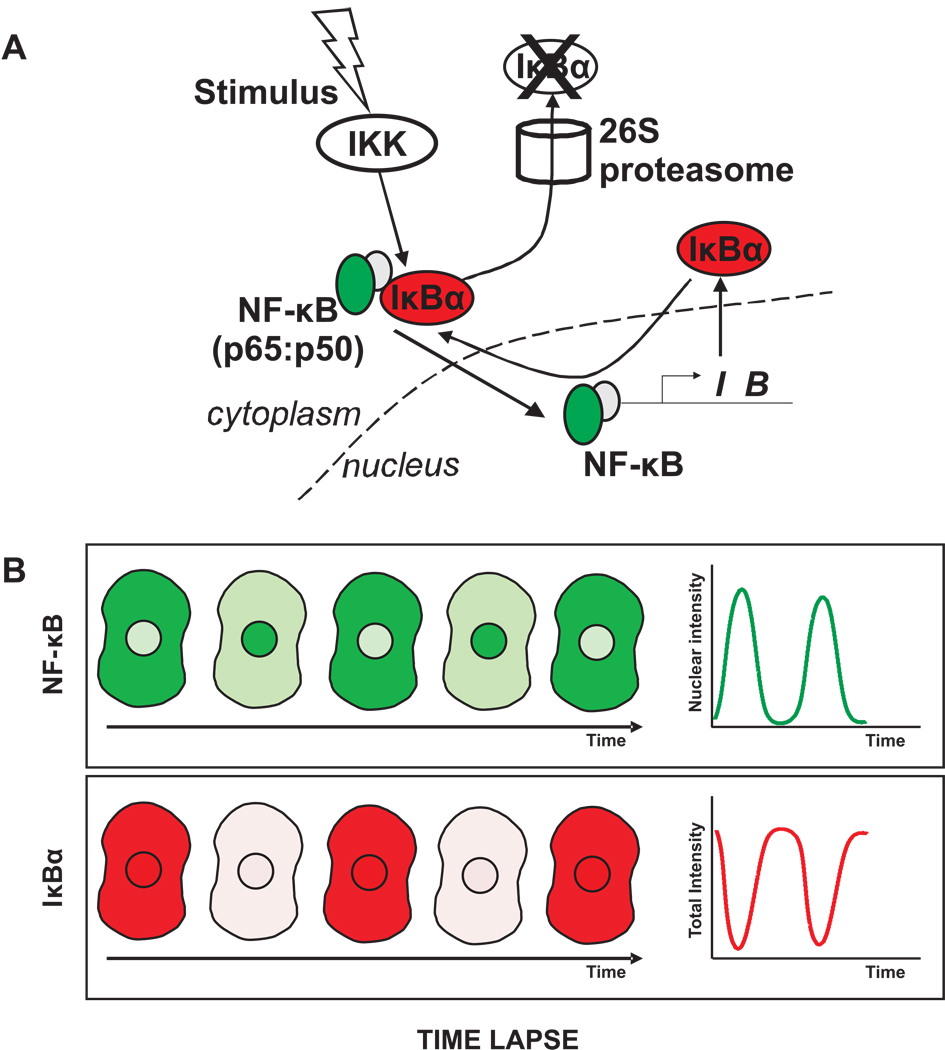
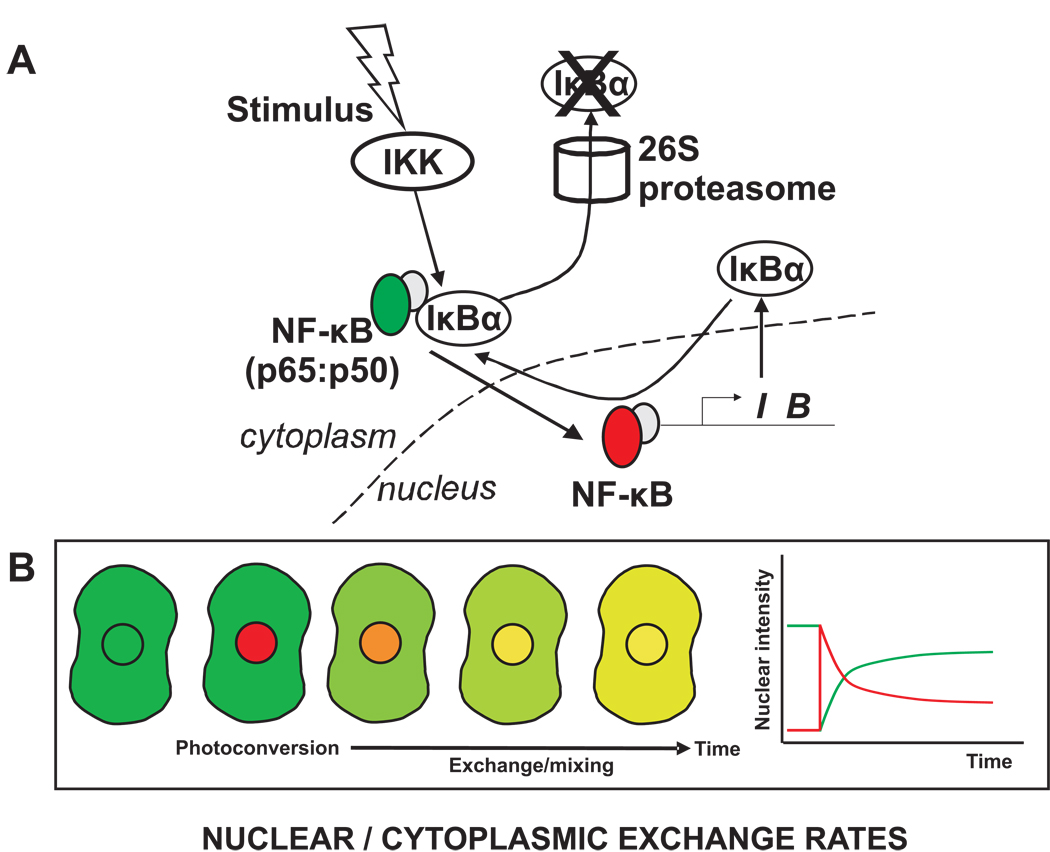
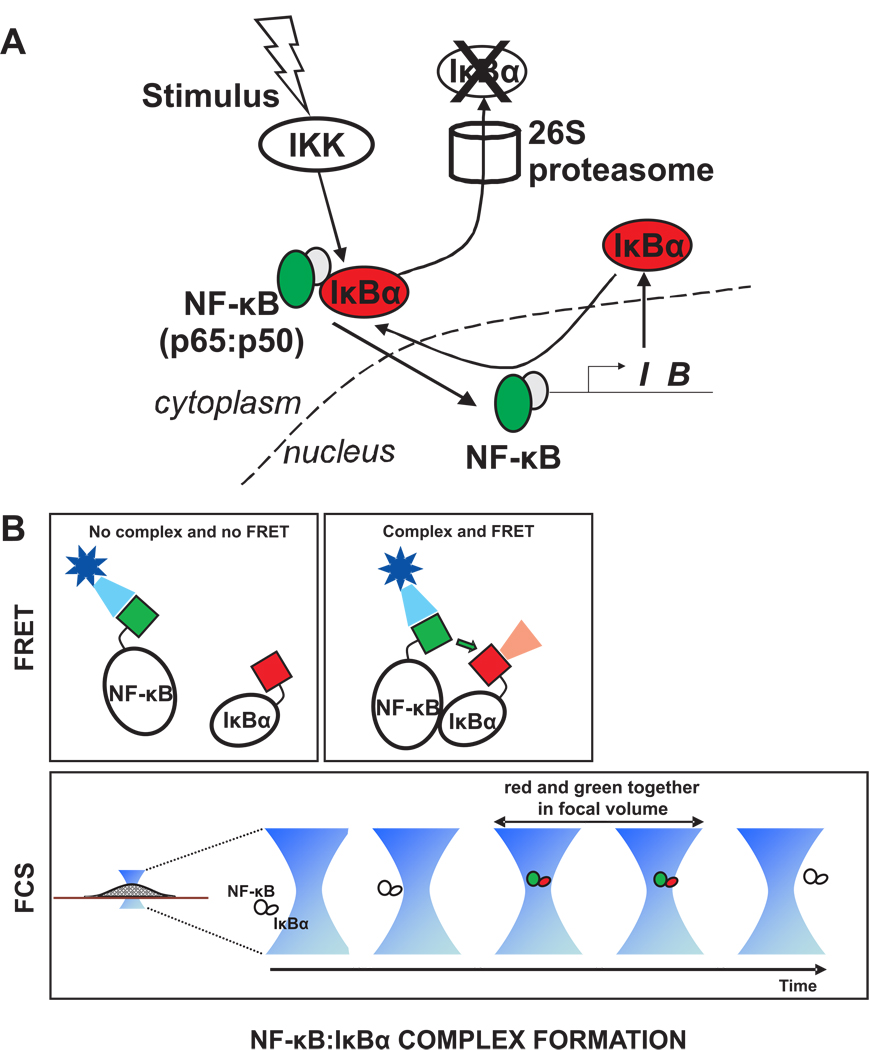
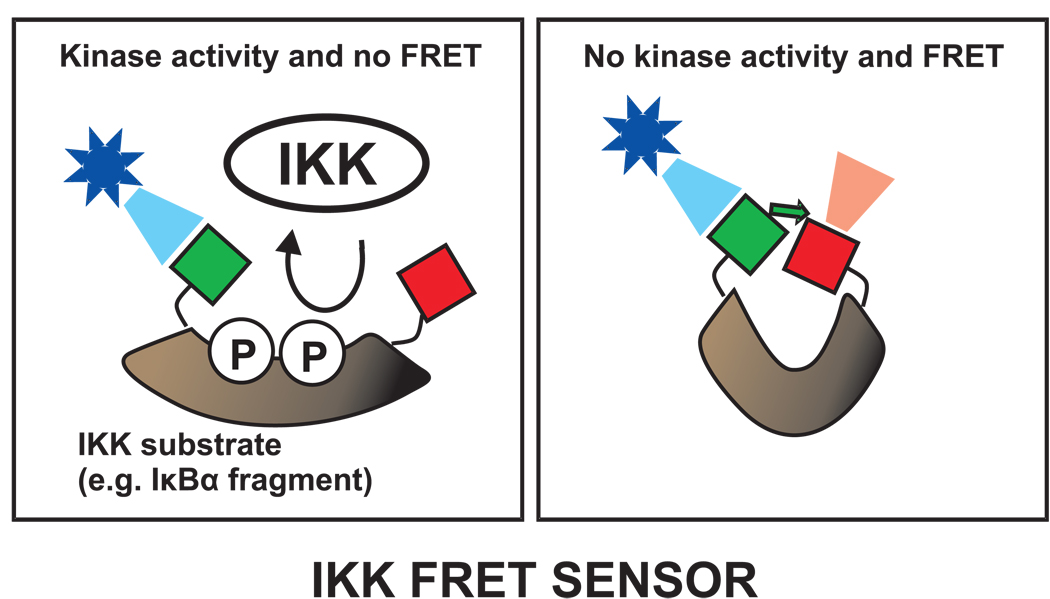
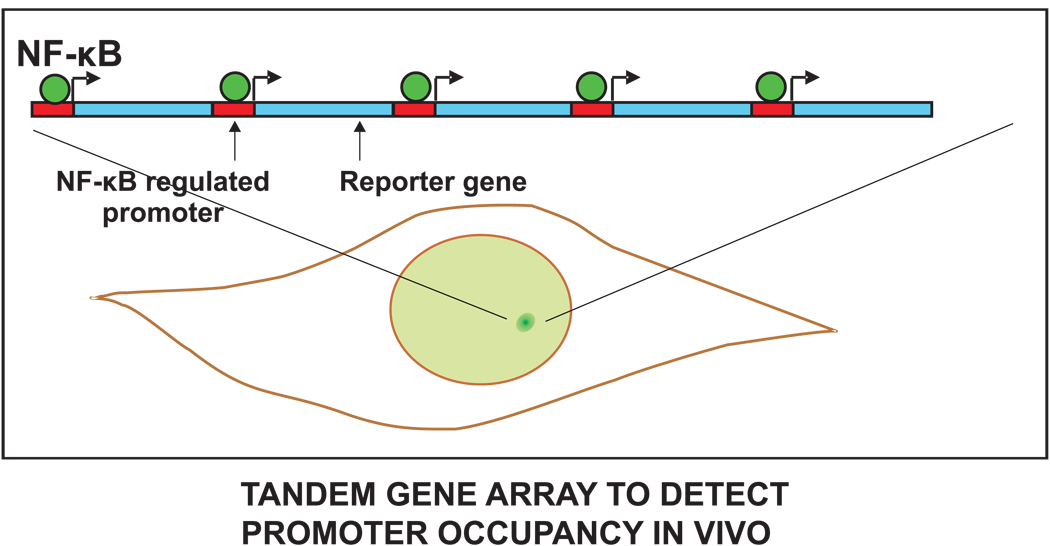
Much of the experimental data used to construct mathematical models of molecular networks are derived from in vitro measurements. However, there is increasing evidence that in vitro measurements fail to capture both the complexity and the individuality found in single, living cells. These limitations can be overcome by live cell microscopy which is evolving to enable in vivo biochemistry. Here, we survey the current capabilities of live cell microscopy and illustrate how a number of different imaging approaches could be applied to analyze a specific molecular network. We argue that incorporation of such quantitative live-cell imaging methods is critical for the progress of systems biology.


Figures

Figure 1
Figure 1. Cellular behaviors that are not captured by population average measurements
A. Individual cells may have dynamic fluctuations that are out of phase (upper panel). This variability disappears in a population average (lower panel). Snapshot measurements in single cells (depicted as grayscale circles in the middle panel) will also yield a misleading result by displaying a range of measured levels at a single time point (arrow). This could be incorrectly interpreted as variability in steady state levels within cells. B. Alternatively, the population may be composed of two different subsets of cells (upper panel). This heterogeneity will be smoothed out in a population average (lower panel), but in this case a snapshot measurement will detect the two populations (middle panel).
Figure 2
Figure 2. Quantitative live cell imaging techniques
A. Time lapse microscopy. Fluorescence intensity in distinct cellular compartments of the same cell can be monitored in real time. B. Fluorescence recovery after photobleaching. A region of interest, shown by the red box, is photobleached with a strong laser pulse and the recovery of intensity within the region is monitored in time. Slower recovery arises if the GFP fusion protein is bound longer to an immobile structure and/or diffusing at a slower rate. C. Fluorescence loss in photobleaching. Repetitive bleaching within a region of interest in one cellular compartment (cytoplasm in this example) is alternated with measurement of intensity in another cellular compartment (nucleus in this example). Fluorescence decays in the second compartment if there is a steady-state exchange between the two compartments. Faster loss in fluorescence generally corresponds to faster exchange. D. Fluorescence correlation spectroscopy. Photon counting in a diffraction-limited spot enables estimates of molecular residence times due to diffusion and/or binding. E. Fluorescence resonance energy transfer. Formation of a complex can be detected when donor (green) and acceptor (red) tags are brought in close proximity (second panel). Improper positioning of the tags can lead to no FRET even when a complex forms (third panel). F. Biosensors based on FRET for detection of small molecules. Binding of the small molecule(s) to the FRET sensor leads to a change in conformation and a corresponding change in FRET. In this example, phosphorylation due to the activity of a kinase would lead to a loss of FRET.
Figure 3
Figure 3. NF-κB as an example molecular network
A simplified network for the canonical NF-κB pathway consisting of active IKK, IκBα, and NF-κB are represented in a navigational map (A) and in a schematic diagram (B). Many upsteam signals (factors like Tumor Necrosis Factor-α, Interleukin-1, and Lipopolysaccharide, or cell surface receptor signaling from T cell/B cell receptors) induce the kinase activity of IKK. Phosphorylation of two specific serines in IκBα by IKK initiates the degradation of IκBα by the proteasome. Free NF-κB then translocates to the nucleus and activates IκBα gene transcription. Newly synthesized IκBα binds to NF-κB in the nucleus or in the cytoplasm. Numerous molecular mechanisms down-regulate the post-stimulus kinase activity of IKK. IKKO indicates an inactive form without catalytic activity. NF-κBnuc represents the nuclear species. NF-κB itself exists most predominantly as a heterodimer of p65 (transcriptionally active) and p50 subunits. Symbols were used in the navigational map (A) according to the WIRE guideline: Briefly, a circle indicates a protein molecule. Boxed circles are protein complexes. A ‘+’ sign in an arrow represents a positive (activating) effect.
Figure 4
Figure 4. Measuring protein levels by time lapse imaging
Time lapse imaging could be used to follow changes in concentration and localization of NF-κB and IκBα within individual cells. A. NF-κB could be tagged with GFP (green) and IκBα with mCherry (red). B. Following stimulation of the pathway, fluorescence images in red and green could be acquired at a series of time points. Due to the IKK-induced degradation and re-synthesis of IκBα proteins, the levels of IκBα are expected to decrease and increase, while the nuclear level of NF-κB is expected to concomitantly increase and decrease. These changes could be quantified by measuring NF-κB fluorescence intensities in the nucleus and IκBα intensities in the whole cell.
Figure 5
Figure 5. Measuring nucleocytoplasmic exchange rates by photo-convertible proteins
A. A photo-convertible protein such as Dronpa could be used to investigate exchange rates of NF-κB between the cytoplasm and nucleus. Dronpa initially exhibits green fluorescence, but activation with the appropriate wavelength converts Dronpa into a red fluorescent protein. B. If photo-conversion is restricted to the nucleus then NF-κB present in the nucleus at that moment will be labeled red and cytoplasmic NF-κB will remain green. If NF-κB exchange occurs between these two compartments, then green fluorescence will enter the nucleus and red fluorescence will enter the cytoplasm. Shown is the green/red overlay image, but measurements in the separate green and red channels would yield the changing intensity profiles shown in the plot.
Figure 6
Figure 6. Measuring protein-protein interactions by FRET or FCS A
Complex formation between NF-κB and IκBα could be detected by labeling NF-κB with GFP (green) and IκBα with mCherry (red). B. FRET could be used to determine if the two molecules are in close proximity, assuming the GFP and mCherry tags (green and red boxes) are appropriately situated on the NF-κB and IκBα molecules. Alternatively, cross-correlation FCS could be used to detect the complex, since red and green tags would be found simultaneously in the focal volume when a complex is present there. Note that for performing cross correlation FCS, the fluorescent tags should be situated to avoid FRET, otherwise the green signal will be reduced due to energy transfer to red.
Figure 7
Figure 7. Measuring phosphorylation events by a FRET sensor
A FRET sensor could be used to detect phosphorylation of IκBα. The sensor would be a specially designed molecule (brown) that would be recognized by the IKK kinase. For example, the IκBα fragment containing the two specific serines (phosphorylated by IKK) would be a candidate. Typically, the phosphorylation sensors unfold after phosphorylation leading to loss of FRET between the donor and acceptor tags, shown here as green and red squares. Changes in FRET therefore reflect IKK activity.
Figure 8
Figure 8. Measuring DNA binding of a transcription factor
The levels of NF-κB binding to a target promoter could be measured by tagging NF-κB with GFP (green) and observing its binding to a tandem gene array. Such an array already exists for NF-κB and promoters containing κB consensus motifs or HIV LTR, and similar design principles could be used to construct an array cell line for any transcription factor. An array is composed of a series of NF-κB target sites (red rectangle) each followed by a reporter gene (blue). The array is stably integrated at a chromosomal locus. Live cells containing the GFP-tagged NF-κB (green circles) exhibit a bright green spot in the nucleus due to clustering of NF-κB sites at the tandem array. The brightness of this spot is proportional to the amount of NF-κB binding to the target site.
Figure 9
Figure 9. Measuring mRNA production
Transcription driven by NF-κB can be detected by using the MS-2 RNA tagging system. A single copy gene is modified such that the transcript includes a series of MS-2 binding sites (red rectangles). The cells also express a GFP-tagged MS-2 binding protein (green circles) at low levels. This binds to the mRNA of the modified gene giving rise to a bright green spot in the nucleus where the newly transcribed mRNA is located. If sufficient MS-2 binding sites are present in the transcript, multiple GFP-MS-2 molecules will bind enabling a single mRNA molecule to be detected. The brightness of the GFP-MS-2 spot corresponds to the amount of mRNA produced.

Similar articles

Cited by

References

    1. Lahav G, Rosenfeld N, Sigal A, Geva-Zatorsky N, Levine AJ, Elowitz MB, et al. Dynamics of the p53-Mdm2 feedback loop in individual cells. Nat Genet. 2004;36:147–150. - PubMed
    1. Nelson DE, Ihekwaba AE, Elliott M, Johnson JR, Gibney CA, Foreman BE, et al. Oscillations in NF-kappaB signaling control the dynamics of gene expression. Science. 2004;306:704–708. - PubMed
    1. Friedman N, Vardi S, Ronen M, Alon U, Stavans J. Precise temporal modulation in the response of the SOS DNA repair network in individual bacteria. PLoS Biol. 2005;3:e238. - PMC - PubMed
    1. Suel GM, Garcia-Ojalvo J, Liberman LM, Elowitz MB. An excitable gene regulatory circuit induces transient cellular differentiation. Nature. 2006;440:545–550. - PubMed
    1. Mellman I, Misteli T. Computational cell biology. J Cell Biol. 2003;161:463–464. - PMC - PubMed