. 2010 Sep 21;49(37):8105-16.
doi: 10.1021/bi100644q.

Kinetic analysis reveals differences in the binding mechanism of calmodulin and calmodulin-like protein to the IQ motifs of myosin-10

Affiliations

Kinetic analysis reveals differences in the binding mechanism of calmodulin and calmodulin-like protein to the IQ motifs of myosin-10

Ariel J Caride et al. Biochemistry. .

Abstract

Myo10 is an unconventional myosin with important functions in filopodial motility, cell migration, and cell adhesion. The neck region of Myo10 contains three IQ motifs that bind calmodulin (CaM) or the tissue-restricted calmodulin-like protein (CLP) as light chains. However, little is known about the mechanism of light chain binding to the IQ motifs in Myo10. Binding of CaM and CLP to each IQ motif was assessed by nondenaturing gel electrophoresis and by stopped-flow experiments using fluorescence-labeled CaM and CLP. Although the binding kinetics are different in each case, there are similarities in the mechanism of binding of CaM and CLP to IQ1 and IQ2: for both IQ motifs Ca(2+) increased the binding affinity, mainly by increasing the rate of the forward steps. The general kinetic mechanism comprises a two-step process, which in some cases may involve the binding of a second IQ motif with lower affinity. For IQ3, however, the kinetics of CaM binding is very different from that of CLP. In both cases, binding in the absence of Ca(2+) is poor, and addition of Ca(2+) decreases the K(d) to below 10 nM. However, while the CaM binding kinetics are complex and best fitted by a multistep model, binding of CLP is fitted by a relatively simple two-step model. The results show that, in keeping with growing structural evidence, complexes between CaM or CaM-like myosin light chains and IQ motifs are highly diverse and depend on the specific sequence of the particular IQ motif as well as the light chain.


Figures

FIGURE 1
FIGURE 1
Sequence of the three IQ motifs in Myo10. The underlined residues are in the positions of the consensus IQ motif IQxxxRGxxxR, and the residues indicated in bold are the hydrophobic residues in positions 1-5-8-14. The first and last residues of each IQ peptide are numbered according to their position in full-length human Myo10.
FIGURE 2
FIGURE 2
Identification of CaM-IQ and CLP-IQ complexes by non-denaturing gel electrophoresis. Complexes were formed and the gels were run as described in the Methods. In panel A, all lanes contained 10 μg CaM. Lanes 2, 4, 6 and 8 also contained 10 μg of CLP. Lanes 3 and 4 contained an amount of IQ1 equimolar with the amount of CaM, lanes 5 and 6 contained equimolar amounts of IQ2, and lanes 7 and 8 contained equimolar amounts of IQ3. In panel B, all lanes contained 10 μg of CLP, lanes 2, 4, 6 and 8 also contained 10 μg CaM, lanes 3 and 4 contained IQ1, lanes 5 and 6 contained IQ2 and lanes 7 and 8 contained IQ3, all in equimolar amounts.
FIGURE 3
FIGURE 3
Titration of TA-CaM and TA-CLP with the IQ motifs of Myo10, in the absence (A, C and E) and in the presence (B, D and F) of Ca2+. Titrations were done by monitoring the fluorescence of TA-CaM or TA-CLP at 25°C in the media described in the Experimental Procedures. When the measurements were done in the absence of Ca2+ the buffer contained 10 mM EGTA. When the measurements were done in the presence of Ca2+, the buffer contained 0.2 mM EGTA and enough CaCl2 to obtain 100 μM free Ca2+. In each case, fluorescence is represented as a percentage of the fluorescence of the sample in the absence of IQ peptide.
FIGURE 4
FIGURE 4
Schematic representation of the kinetic models used for fitting the data obtained in the stopped flow experiments described in Figures 5–9. TA-C stands for either TA-CaM or TA-CLP. TA-C-IQ*, TA-C-IQ**, and TA-C-IQ^ denote different conformations of the complex of TA-CaM or TA-CLP with IQ peptide.
FIGURE 5
FIGURE 5
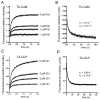
Kinetics of binding of TA-CaM and TA-CLP to IQ1 in the absence of Ca2+. (A) and (C): Time course of fluorescence changes upon mixing 17 nM TA-CaM (A) or 17 nM TA-CLP (C) with the indicated concentrations of IQ1. The experimental data were best fitted (continuous blue line) with the model and kinetic constants shown in Table 2. For comparison, the fit using the simpler one-step model is also shown as stippled red line, clearly indicating a poorer fit especially at higher IQ1 concentrations. (B) and (D): Progress curves of the dissociation of TA-CaM (B) or TA-CLP (D) from IQ1. 34 nM TA-CaM or 34 nM TA-CLP were pre-mixed with 2 μM IQ1, and dissociation was initiated by adding 10 μM CaM (B) or 10 μM CLP (D). The progress curves were fitted with a sum of 2 exponentials, yielding the constants shown in the figure. All media contained 10 mM EGTA. In all cases, the indicated concentrations are after final mixing.
FIGURE 6
FIGURE 6
Kinetics of binding of TA-CaM and TA-CLP to IQ1 in the presence of 100 μM free Ca2+. (A) and (C): Time course of fluorescence changes upon mixing 17 nM TA-CaM (A) or 17 nM TA-CLP (C) with the indicated concentrations of IQ1. The experimental data were fitted with the models and kinetic constants shown in Table 2. (B) and (D): Progress curves of the dissociation of TA-CaM (B) or TA-CLP (D) from IQ1. 34 nM TA-CaM or 34 nM TA-CLP were pre-mixed with 0.2 μM IQ1, and dissociation was started by adding 1 μM CaM (B) or 1 μM CLP (D). The progress curves were fitted with a sum of 2 exponentials, with the constants shown in the figure. All media contained 0.2 mM EGTA and enough CaCl2 to obtain 100 μM Ca2+. In all cases, the indicated concentrations are after final mixing.
FIGURE 7
FIGURE 7
Kinetics of binding of TA-CaM and TA-CLP to IQ2 in the absence of Ca2+. (A) and (C): Time course of fluorescence changes upon mixing 17 nM TA-CaM (A) or 17 nM TA-CLP (C) with the indicated concentrations of IQ2. The experimental data were fitted (smooth black lines) with the models and kinetic constants shown in Table 2. (B) and (D): Progress curves of the dissociation of TA-CaM (B) or TA-CLP (D) from IQ2. 34 nM TA-CaM or 34 nM TA-CLP were pre-mixed with 0.2 μM IQ2, and dissociation was initiated by adding 1 μM CaM (B) or 1 μM CLP (D). The progress curves were fitted with a sum of 2 exponentials, with the rate constants shown in the figure. All media contained 10 mM EGTA. In all cases, the indicated concentrations are after final mixing.
FIGURE 8
FIGURE 8
Kinetics of binding of TA-CaM and TA-CLP to IQ2 in the presence of 100 μM free Ca2+. (A) and (C): Time course of fluorescence changes upon mixing 17 nM TA-CaM (A) or 17 nM TA-CLP (C) with the indicated concentrations of IQ2. The experimental data were fitted (smooth black lines) with the models and kinetic constants shown in Table 2. (B) and (D): Progress curves of the dissociation of TA-CaM (B) or TA-CLP (D) from IQ2. 34 nM TA-CaM or 34 nM TA-CLP were pre-mixed with 0.2 μM IQ2, and dissociation was started by adding 1 μM CaM (B) or 1 μM CLP (D). The progress curves were fitted with a sum of 2 exponentials, with the constants shown in the figure. All media contained 0.2 mM EGTA and enough CaCl2 to obtain 100 μM Ca2+. In all cases, the indicated concentrations are after final mixing.
FIGURE 9
FIGURE 9
Kinetics of binding of TA-CaM and TA-CLP to IQ3 in the presence of 100 μM free Ca2+. (A) and (C): Time course of fluorescence changes upon mixing 17 nM TA-CaM (A) or 17 nM TA-CLP (C) with the indicated concentrations of IQ3. In panel C, the data obtained with 0.2, 0.4 and 0.8 μM IQ3 were omitted from the figure for the sake of clarity, but the accuracy of the fit was comparable to that shown in the figure. The experimental data were fitted (smooth black line) with the models and kinetic constants shown in Table 2. (B) and (D): Time course of the dissociation of TA-CaM (B) or TA-CLP (D) from IQ3. 34 nM TA-CaM or 34 nM TA-CLP were pre-mixed with 0.2 μM IQ3, and dissociation was started by adding 1 μM CaM (B) or 1 μM CLP (D). In panel B, the progress curve could be fitted with a sum of 2 exponentials, with the constants indicated in the figure. In contrast, dissociation of IQ3 from TA-CLP is slower (k = 0.015 s−1) and results in an increase of fluorescence (panel D). All media contained 0.2 mM EGTA and enough CaCl2 to obtain 100 μM Ca2+. In all cases, the indicated concentrations are after final mixing.

Similar articles

Cited by

References

    1. Berg JS, Derfler BH, Pennisi CM, Corey DP, Cheney RE. Myosin-X, a novel myosin with pleckstrin homology domains, associates with regions of dynamic actin. J Cell Sci. 2000;113:3439–3451. - PubMed
    1. Berg JS, Cheney RE. Myosin-X is an unconventional myosin that undergoes intrafilopodial motility. Nature Cell Biol. 2002;4:246–250. - PubMed
    1. Toyoshima F, Nishida E. Integrin-mediated adhesion orients the spindle parallel to the substratum in an EB1- and myosin X-dependent manner. EMBO J. 2007;26:1487–1498. - PMC - PubMed
    1. Woolner S, O’Brien LL, Wiese C, Bement WM. Myosin-10 and actin filaments are essential for mitotic spindle formation. J Cell Biol. 2008;182:77–88. - PMC - PubMed
    1. Yonezawa S, Yoshizaki N, Sano M, Hanai A, Masaki S, Takizawa T, Kageyama T, Moriyama A. Possible involvement of myosin-X in intercellular adhesion: importance of serial pleckstrin homology regions for intracellular localization. Develop Growth Differ. 2003;45:175–185. - PubMed

Publication types