

Identification of a unique ganglioside binding loop within botulinum neurotoxins C and D-SA
- PMID: 20731382
- PMCID: PMC2939319
- DOI: 10.1021/bi100865f
Identification of a unique ganglioside binding loop within botulinum neurotoxins C and D-SA
Abstract
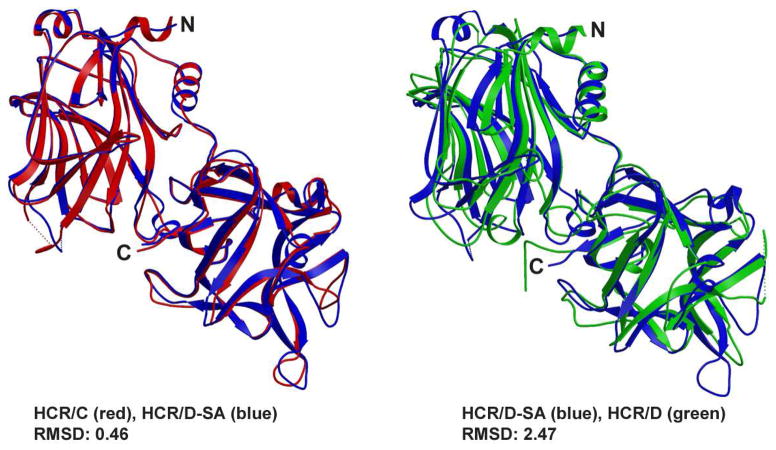
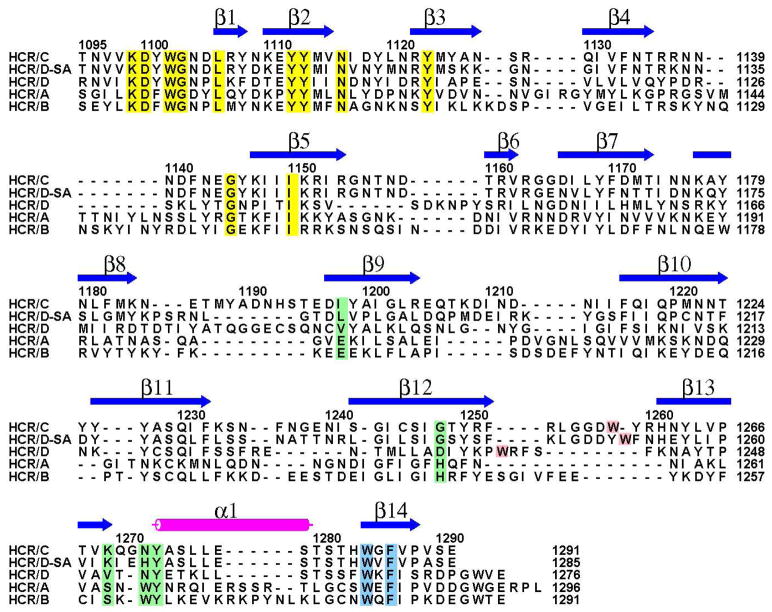
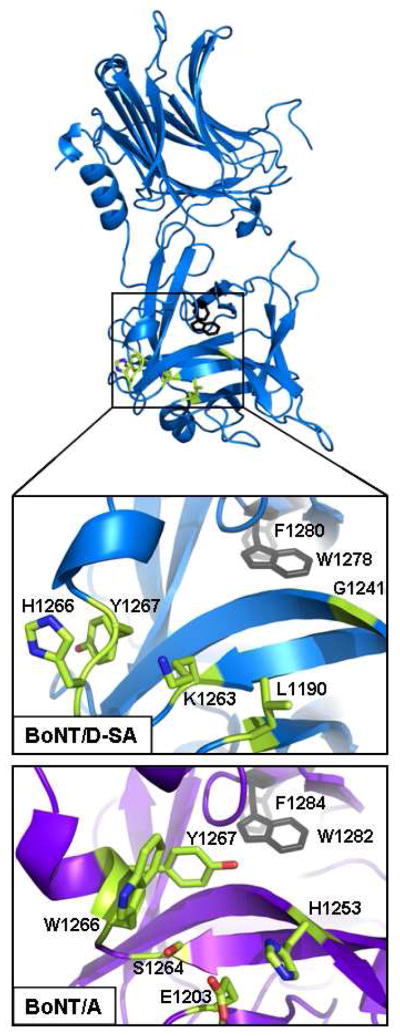
The botulinum neurotoxins (BoNTs) are the most potent protein toxins for humans. There are seven serotypes of BoNTs (A-G) based on a lack of cross antiserum neutralization. BoNTs utilize gangliosides as components of the host receptors for binding and entry into neurons. Members of BoNT/C and BoNT/D serotypes include mosaic toxins that are organized in D/C and C/D toxins. One D/C mosaic toxin, BoNT/D-South Africa (BoNT/D-SA), was not fully neutralized by immunization with BoNT serotype C or D, which stimulated this study. Here the crystal structures of the receptor binding domains of BoNT/C, BoNT/D, and BoNT/D-SA are presented. Biochemical and cell binding studies show that BoNT/C and BoNT/D-SA possess unique mechanisms for ganglioside binding. These studies provide new information about how the BoNTs can enter host cells as well as a basis for understanding the immunological diversity of these neurotoxins.
Figures
Similar articles
-
Unique ganglioside binding by botulinum neurotoxins C and D-SA.FEBS J. 2011 Dec;278(23):4486-96. doi: 10.1111/j.1742-4658.2011.08166.x. Epub 2011 May 31. FEBS J. 2011. PMID: 21554541 Free PMC article. Review.
-
Botulinum neurotoxin serotype C associates with dual ganglioside receptors to facilitate cell entry.J Biol Chem. 2012 Nov 23;287(48):40806-16. doi: 10.1074/jbc.M112.404244. Epub 2012 Oct 1. J Biol Chem. 2012. PMID: 23027864 Free PMC article.
-
Novel ganglioside-mediated entry of botulinum neurotoxin serotype D into neurons.J Biol Chem. 2011 Jul 29;286(30):26828-37. doi: 10.1074/jbc.M111.254086. Epub 2011 Jun 1. J Biol Chem. 2011. PMID: 21632541 Free PMC article.
-
Unique biological activity of botulinum D/C mosaic neurotoxin in murine species.Infect Immun. 2012 Aug;80(8):2886-93. doi: 10.1128/IAI.00302-12. Epub 2012 Jun 4. Infect Immun. 2012. PMID: 22665374 Free PMC article.
-
Variations in the Botulinum Neurotoxin Binding Domain and the Potential for Novel Therapeutics.Toxins (Basel). 2018 Oct 20;10(10):421. doi: 10.3390/toxins10100421. Toxins (Basel). 2018. PMID: 30347838 Free PMC article. Review.
Cited by
-
The Light Chain Defines the Duration of Action of Botulinum Toxin Serotype A Subtypes.mBio. 2018 Mar 27;9(2):e00089-18. doi: 10.1128/mBio.00089-18. mBio. 2018. PMID: 29588398 Free PMC article.
-
Crystal structure of the receptor binding domain of the botulinum C-D mosaic neurotoxin reveals potential roles of lysines 1118 and 1136 in membrane interactions.Biochem Biophys Res Commun. 2011 Jan 7;404(1):407-12. doi: 10.1016/j.bbrc.2010.11.134. Epub 2010 Dec 3. Biochem Biophys Res Commun. 2011. PMID: 21130733 Free PMC article.
-
Enhancing the protective immune response against botulism.Infect Immun. 2013 Jul;81(7):2638-44. doi: 10.1128/IAI.00382-13. Epub 2013 May 13. Infect Immun. 2013. PMID: 23670557 Free PMC article.
-
Crystal structures of botulinum neurotoxin DC in complex with its protein receptors synaptotagmin I and II.Structure. 2013 Sep 3;21(9):1602-11. doi: 10.1016/j.str.2013.06.026. Epub 2013 Aug 8. Structure. 2013. PMID: 23932591 Free PMC article.
-
Structural analysis of the receptor binding domain of botulinum neurotoxin serotype D.Biochem Biophys Res Commun. 2010 Oct 29;401(4):498-503. doi: 10.1016/j.bbrc.2010.09.063. Epub 2010 Sep 19. Biochem Biophys Res Commun. 2010. PMID: 20858456 Free PMC article.
References
-
- Lacy DB, Tepp W, Cohen AC, DasGupta BR, Stevens RC. Crystal structure of botulinum neurotoxin type A and implications for toxicity. Nat Struct Mol Biol. 1998;5:898–902. - PubMed
-
- Kumaran D, Eswaramoorthy S, Furey W, Navaza J, Sax M, Swaminathan S. Domain Organization in Clostridium botulinum Neurotoxin Type E Is Unique: Its Implication in Faster Translocation. Journal of Molecular Biology. 2009;386:233–245. - PubMed
-
- Montecucco C, Schiavo G. Structure and function of tetanus and botulinum neurotoxins. Quarterly Reviews of Biophysics. 1995;28:423–472. - PubMed
-
- Montecucco C, Schiavo G. Tetanus and botulism neurotoxins: a new group of zinc proteases. Trends in Biochemical Sciences. 1993;18:324–327. - PubMed
Publication types
MeSH terms
Substances
Associated data
- Actions
- Actions
- Actions
- Actions
Grants and funding
LinkOut - more resources
Full Text Sources
Other Literature Sources
