. 2010 Sep 22;132(37):13026-45.
doi: 10.1021/ja105485b.

Solution structure of the 128 kDa enzyme I dimer from Escherichia coli and its 146 kDa complex with HPr using residual dipolar couplings and small- and wide-angle X-ray scattering

Affiliations

Solution structure of the 128 kDa enzyme I dimer from Escherichia coli and its 146 kDa complex with HPr using residual dipolar couplings and small- and wide-angle X-ray scattering

Charles D Schwieters et al. J Am Chem Soc. .

Abstract

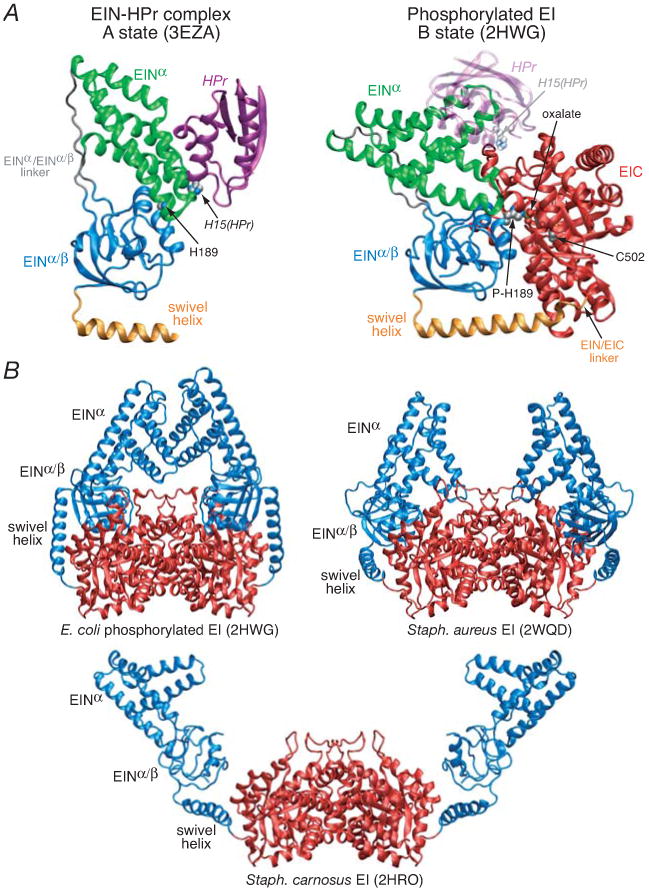
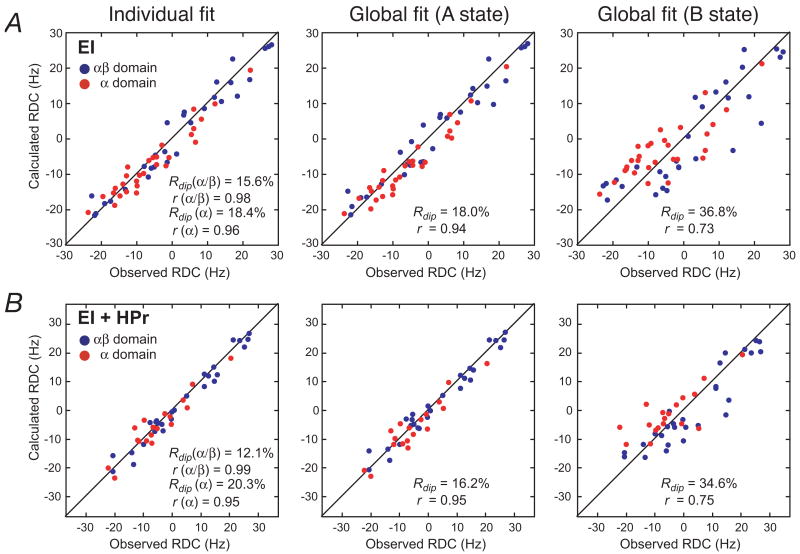
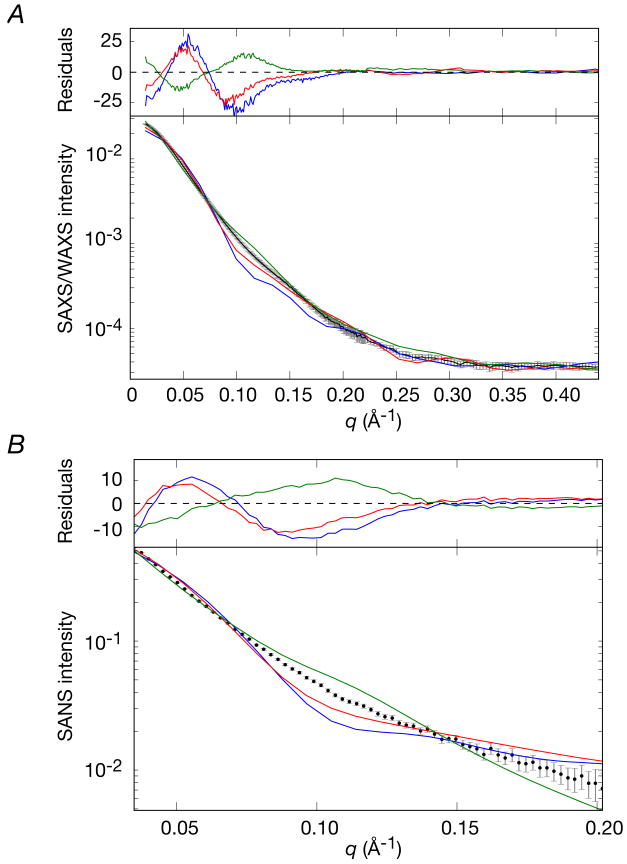
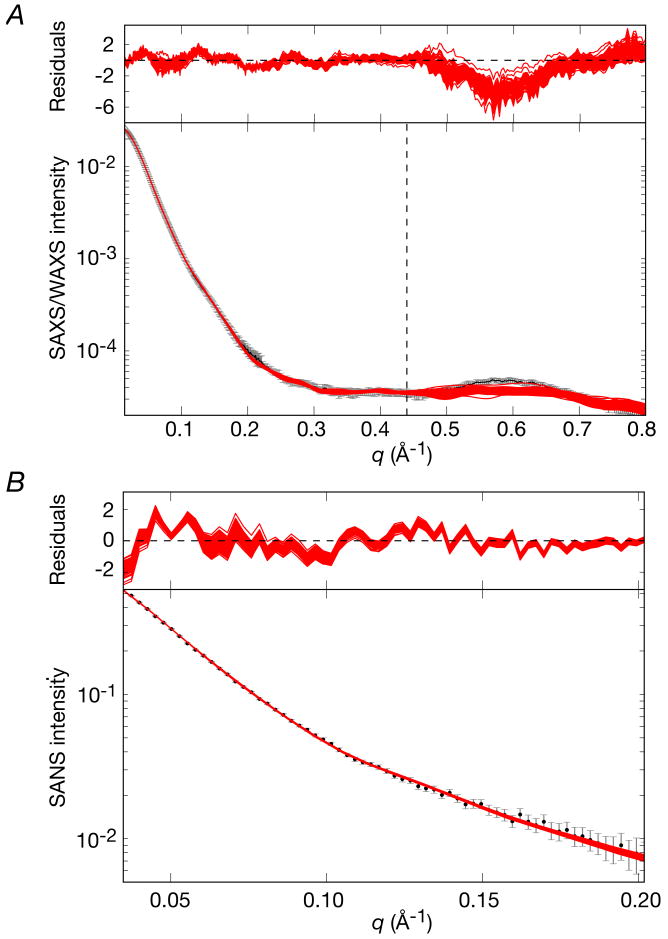
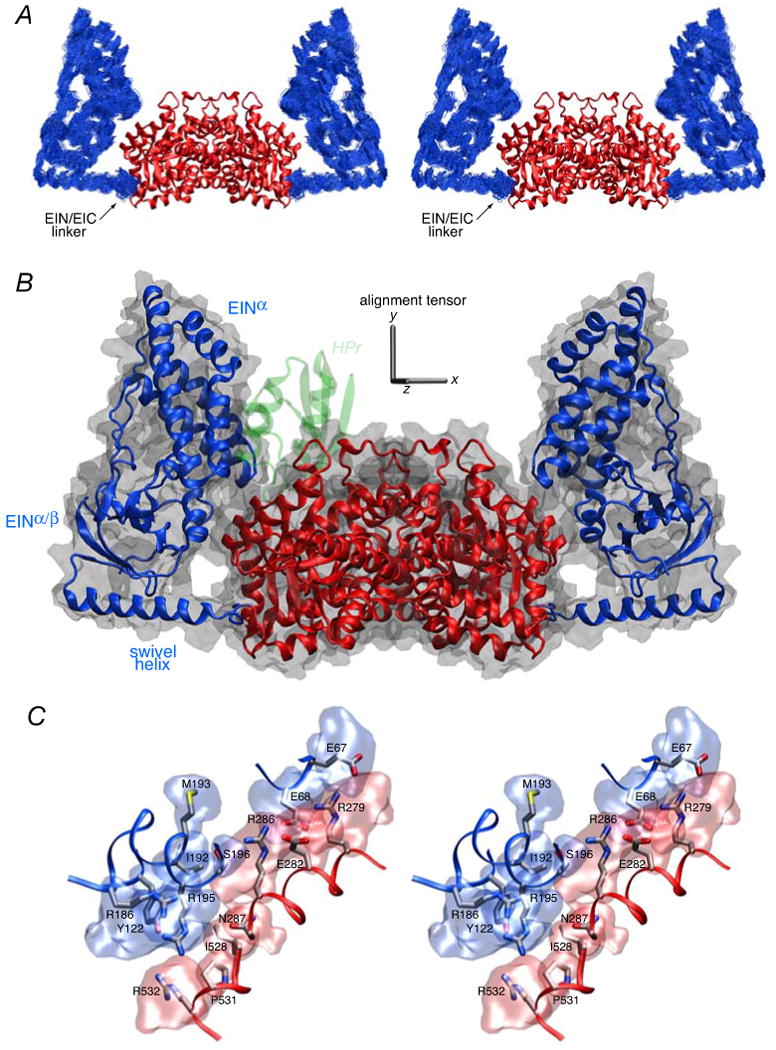
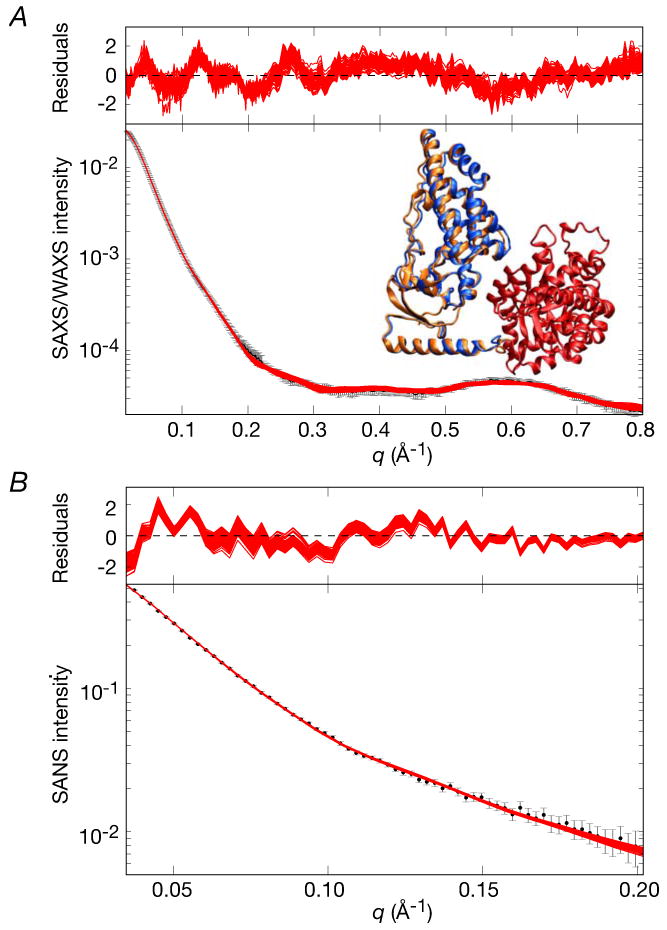
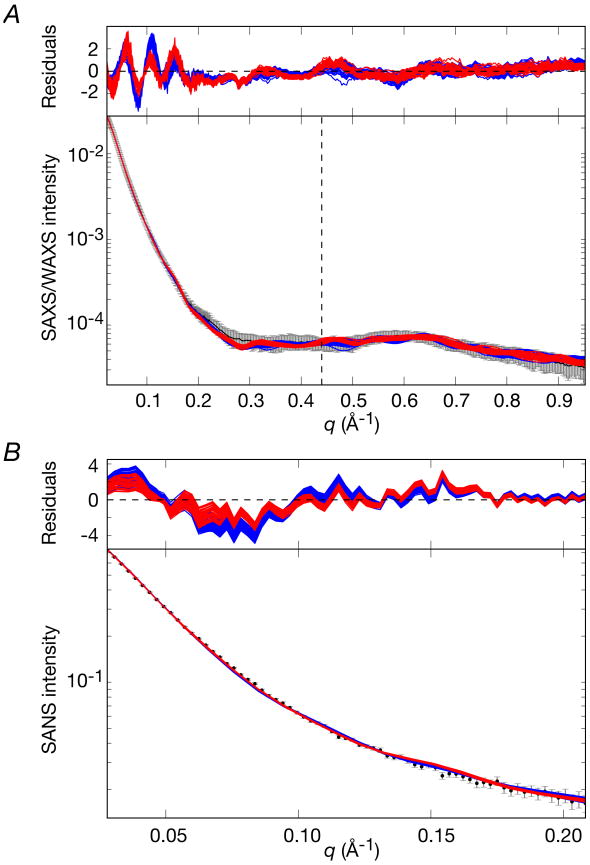
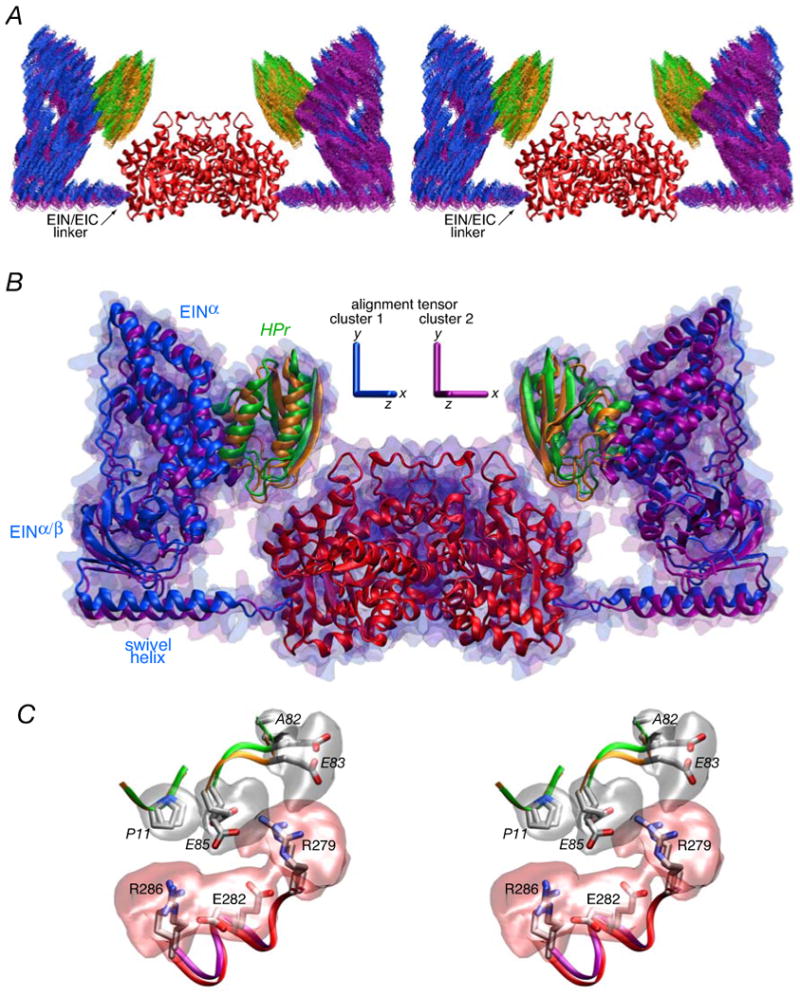
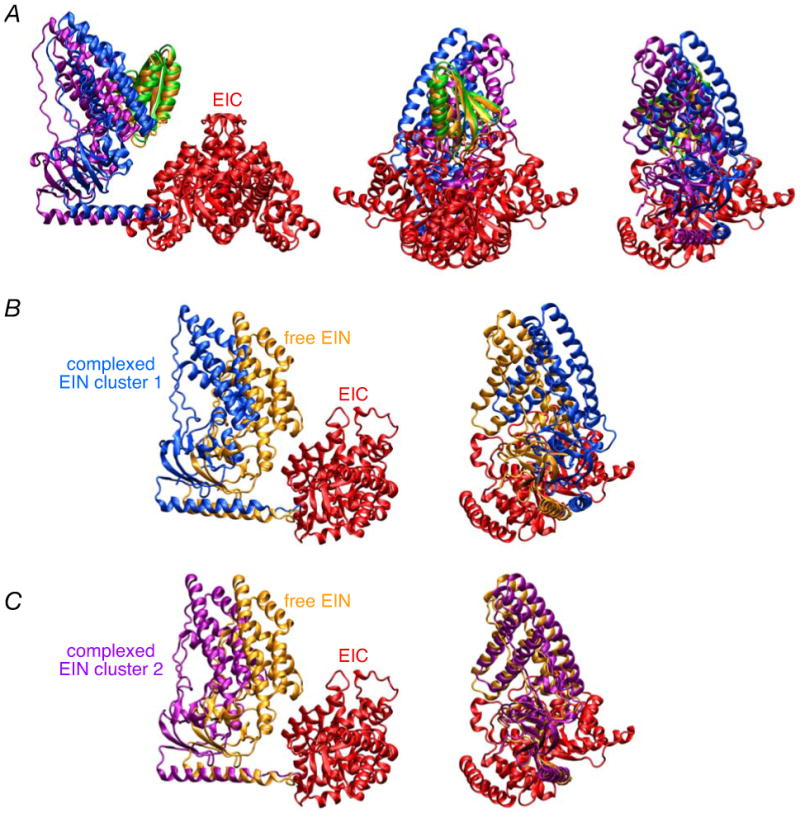
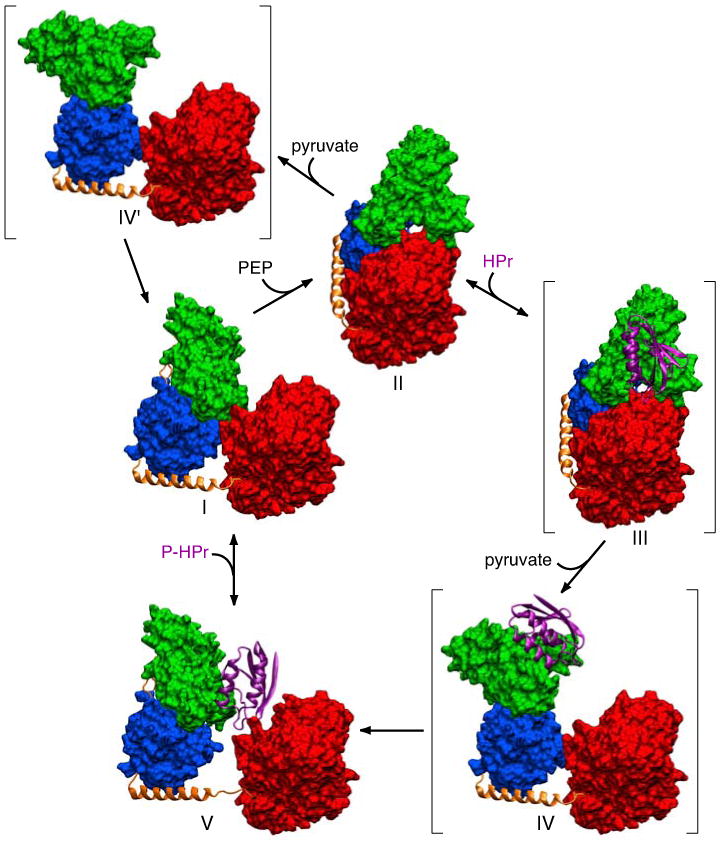
The solution structures of free Enzyme I (EI, ∼128 kDa, 575 × 2 residues), the first enzyme in the bacterial phosphotransferase system, and its complex with HPr (∼146 kDa) have been solved using novel methodology that makes use of prior structural knowledge (namely, the structures of the dimeric EIC domain and the isolated EIN domain both free and complexed to HPr), combined with residual dipolar coupling (RDC), small- (SAXS) and wide- (WAXS) angle X-ray scattering and small-angle neutron scattering (SANS) data. The calculational strategy employs conjoined rigid body/torsion/Cartesian simulated annealing, and incorporates improvements in calculating and refining against SAXS/WAXS data that take into account complex molecular shapes in the description of the solvent layer resulting in a better representation of the SAXS/WAXS data. The RDC data orient the symmetrically related EIN domains relative to the C(2) symmetry axis of the EIC dimer, while translational, shape, and size information is provided by SAXS/WAXS. The resulting structures are independently validated by SANS. Comparison of the structures of the free EI and the EI-HPr complex with that of the crystal structure of a trapped phosphorylated EI intermediate reveals large (∼70-90°) hinge body rotations of the two subdomains comprising the EIN domain, as well as of the EIN domain relative to the dimeric EIC domain. These large-scale interdomain motions shed light on the structural transitions that accompany the catalytic cycle of EI.


Figures

Figure 1
Figure 1. Summary of available structure information on EI
(A) Comparison of the solution NMR structure of the isolated E. coli EIN domain complexed to HPr (3EZA) which we refer to as the A state of the EIN domain (left panel) with that observed in the crystal structure of the phosphorylated EI intermediate from E. coli (2HWG) which we refer to as the B state of the EIN domain (right panel), displayed in the same orientation of the EINα/β subdomain. Only a single subunit of the phosphorylated EI dimer is shown. The structures are depicted as ribbon diagrams with the EINα and EIN α/β subdomains shown in green and blue, respectively, the swivel helix connecting the EIN and EIC domains in orange, the EIC domain in red, and HPr in purple (left panel) and transparent purple (right panel). His189 (located in the EINα/β subdomain; left panel), phospho-His189 (right panel), Cys502 (right panel), the oxalate anion (right panel) and His15 of HPr are shown as space-filling models color-coded according to atom type. HPr bound to the EINα subdomain in the same orientation as in the EIN-HPr complex is shown as a transparent ribbon in the right panel to demonstrate that the HPr binding site is available in the phosporylated EI intermediate (B state) and that there are no steric clashes between HPr and the EIC domain in this conformation of EI. (B) Comparison of the crystal structures of the phosphorylated EI intermediate from E. coli (2HWG) and free EI from Staph. aureus (2WQD) and Staph. carnosus (2HRO), with the EIN and EIC domains shown in blue and red, respectively. Note that the orientation of the EINα and EINα/β subdomains in isolated EIN (both in solution, and in the crystal state11) is the same as that seen in the crystal structure of free EI from Staph. aureus (2WQD17). The EINα/β subdomain in Staph. carnosus EI is partially disordered with some regions not visible in the electron density map. The structure of the EIC dimerization domain in all three EI crystal structures is essentially the same (Cα rms differences of less than 1 Å).
Figure 2
Figure 2. Visualization of a portion of the boundary layer scatterers
The green lines depict a portion of the tessellated surface generated using atomic radii (+3 Å). An inner surface (transparent green surface) was generated by dropping line segments (white lines) 3 Å in the direction opposite the surface normals at each vertex. A scattering center (red) was located at the center of each voxel at yk defined by the outer and inner triangular patches. The orange spheres correspond to heavy atoms of the molecule. The scattering from each voxel is represented as a sphere of uniform density and radius rk, corresponding to the voxel's volume.
Figure 3
Figure 3. Self-association of EI and binding of HPr to EI
(A) Determination of the EI monomer-dimer self-association constant by sedimentation velocity. Population isotherms based on sedimentation velocity data showing the contributions of the EI monomer (red) and dimer (blue). All signals were normalized to a cell path length of 12 mm. The best-fit analysis in terms of a reversible monomer-dimer equilibrium is depicted by the solid lines. (B) ITC data for the binding of HPr to EI at 25 and 37°C. The solid lines represent best-fits to the data using a simple binding isotherm. The concentration of EI is expressed in monomer units.
Figure 4
Figure 4. Comparison of 1H-15N correlation specta E. coli EI and EIN
The 2D 15N-1H TROSY-correlation spectrum of the intact 128 kDa E. coli EI dimer (black, residues 1-573) is superimposed on the spectrum of the isolated monomeric EIN domain (red, residues 1-249) recorded at 800 MHz and 37°C. Clearly resolved cross-peaks in the EIN spectrum that are either not shifted or minimally shifted in intact EI are labeled, thereby permitting direct transfer of assignments of these cross-peaks from the EIN to the EI spectrum.
Figure 5
Figure 5. RDC analysis of (A) EI and (B) the EI-HPr complex
Panels provide a comparison of the observed and calculated RDCs obtained by SVD fits to the individual EINα and EINα/β subdomains (left panel), and global fits to the EIN domain in the A (middle panels) and B (right panels) states. The coordinates of the A state are taken from the NMR coordinates of the EIN-HPr complex (3EZA); for the B state, the NMR coordinates of the two subdomains, EINα and EINα/β, were best-fitted onto the X-ray coordinates of phosphorylated EI (2HWG). The RDC data for the EINα and EINα/β subdomains are displayed in red and blue, respectively. Rdip and r are the RDC R-factor and Pierson correlation coefficient, respectively.
Figure 6
Figure 6. Comparison of the experimental SAXS/WAXS and SANS curves measured for free E. coli EI with the best-fit SAXS/WAXS and SANS curves calculated for the three X-ray structures of EI
(A) SAXS and (B) SANS. Black, experimental SAXS/WAXS and SANS curves (grey vertical error bars, 1 s.d.); phosphorylated EI from E. coli (2HWG, blue) and free EI from Staph aureus (2WQD, red) and Staph carnosus (2HRO, green). The abrupt change in the magnitude of the error bars in the SAXS/WAXS curve at q = 0.22 Å-1 represents the change in geometry of the instrument from the SAXS (4 m detector distance) to WAXS (36 cm detector distance) regimes. The χ2 of the fits are provided in Table 2. The residuals, given by (IicalcIiobs)/erri, are plotted above each panel.
Figure 7
Figure 7. Comparison of experimental SAXS/WAXS and SANS curves for free EI with the calculated curves for the simulated annealing structures obtained by refinement against the SAXS/WAXS and RDC data
(A) SAXS/WAXS and (B) SANS. The experimental data is shown in black with gray vertical bars equal to 1 s.d.; the calculated curves for the final 100 simulated annealing structures are shown in red. The residuals, given by (IicalcIiobs)/erri, are plotted above each panel. The structures were determined by fitting the SAXS/WAXS curve in the range q ≤ 0.44 Å-1, and the upper end of this range is indicated by the vertical dashed black line in panel A.
Figure 8
Figure 8. The structure of free EI determined from RDC and SAXS data
(A) Stereoview of a best-fit superposition (to the EIC dimer which remains fixed) of the 100 finals simulated annealing structures. The backbone (N, Cα, C′) atoms of the EIN domain are shown in blue, and the EIC domain is depicted as a ribbon diagram in red. (B) Ribbon diagram of the restrained regularized mean coordinates with the same color coding for the EIN and EIC domains as in panel A. The molecular surface of EI is shown in transparent gray, and the location of HPr docked to the EIN domain is depicted in transparent green to show that in this configuration there would be steric clash between HPr and the EIC domain. The axis of the alignment tensor is shown in gray; the y axis of the alignment tensor coincides with the C2 symmetry axis of the symmetric dimer. (C) Stereoview of side chain interactions between the EIN and EIC domains in free EI. The backbones of the EIN and EIC domains (from the restrained regularized mean structure) are depicted as blue and red tubes, respectively; the side chains are color coded according to atom type (carbon, gray; nitrogen, blue; oxygen, red; sulfur, yellow), and reweighted atomic probability maps (plotted at a threshold of 15% of maximum and calculated from the 100 final simulated annealing structures) for the side chains of the EIN and EIC domains at the EIN/EIC interface are shown as transparent bue and red surfaces, respectively. The interfacial side chains adopt a range of rotameric states within the conformational space delineated by the atomic probability map since there are no direct experimental restraints on these side chains; therefore the interfacial side chain positions shown within the probability map are representative rotameric states to guide the eye.
Figure 9
Figure 9. Comparison of the experimental SAXS/WAXS and SANS curves for free EI with the calculated curves for the simulated annealing structures obtained by refinement against the complete SAXS/WAXS data (q ≤ 0.8 Å-1) and RDC data
(A) SAXS/WAXS and (B) SANS. The experimental data is shown in black with gray vertical bars equal to 1 s.d.; the calculated curves for the final 100 simulated annealing structures are shown in red. The residuals, given by (IicalcIiobs)/erri, are plotted above each panel. The inset in panel (A) shows a best-fit superposition (fitted to the EIC domain shown in red) of the restrained regularized mean structures obtained with q ≤ 0.8 Å-1 and ≤ 0.44 Å-1 with their EIN domains shown in orange and blue, respectively. Only a single subunit of EI is displayed; the view is the same as that in Figs. 8A and B.
Figure 10
Figure 10. Comparison of experimental SAXS/WAXS and SANS curves for the EI-HPr complex with the calculated curves for the simulated annealing structures obtained by refinement against the SAXS and RDC data
(A) SAXS/WAXS and (B) Contrast-matched SANS. The SANS data were recorded on a 2H-EI/1H-HPr sample in matched 40.4% D2O so that the SANS curve depends only on the coordinates of the EI component of the complex. The experimental data is shown in black with grey vertical bars equal to 1 s.d.; the calculated curves for the final 100 simulated annealing structures are shown in red for cluster 1(33 structures) and blue for cluster 2 (67 structures). The residuals, given by (IicalcIiobs)/erri, are plotted above each panel. The structures were determined by fitting the SAXS curve in the range q ≤ 0.44 Å-1, and the upper end of this range is indicated by the vertical dashed black line in panel A.
Figure 11
Figure 11. The structure of the EI-HPr complex determined from RDC and SAXS data
(A) Stereoview of a best-fit superposition (to the EIC domain dimer which remains fixed) of the final 100 simulated annealing structures. The backbone (N, Cα, C′) atoms of the EIN domain and HPr are shown in blue and green, respectively for cluster 1 (33 structures) and in purple and orange, respectively, for cluster 2 (67 structures). The EIC domain dimer is shown as a red ribbon. (B) Ribbon diagram of the restrained regularized mean coordinates for clusters 1 and 2 superimposed on the EIC domain. The color coding of HPr and the EIN and EIC domains is the same as in panel A. The molecular surface of the EI-HPr complex is shown in transparent blue for cluster 1 and transparent purple for cluster 2. (C) Stereoview of side chain interactions between HPr and the EIC domain in the EI-HPr complex. The backbones of HPr and the EIC domain are depicted as green and red tubes, respectively, for cluster 1, and orange and purple tubes, for cluster 2. The backbone atoms of residues 11-13 and 82-85 of HPr and residues 279-286 of EIC for the restrained regularized mean coordinates of the two clusters are best-fitted to each other. The side chains from the two clusters are color coded according to atom type (carbon, gray; nitrogen, blue; oxygen, red; sulfur, yellow), and reweighted atomic probability maps (plotted at a threshold of 15% of maximum and calculated from the 100 final simulated annealing structures (clusters 1 and 2 combined) for the side chains of HPr and EIC at the HPr/EIC interface are shown as transparent gray and red surfaces, respectively. Residues of HPr are labeled in italics.
Fig. 12
Fig. 12. Comparison of the restrained regularized mean coordinates of the cluster 1 and cluster 2 solutions for the EI-HPr complex to each other and to the restrained regularized mean coordinates of free EI
(A) Ribbon diagrams showing (A) three views of a comparison of cluster 1 and cluster 2, and two views of a comparison of (B) cluster 1 versus free EI and (C) cluster 2 versus free EI. In all cases, the EIC domain dimer is best-fitted. The color coding is as follows. EIN domain: cluster 1, blue; cluster 2, purple; free, yellow. HPr: cluster 1, green; cluster 2, orange. EIC domain, red. In the left and middle panels of A, the EIC dimer is shown; in all other panels, only one subunit of the EIC domain is displayed. The two views shown in (B) and (C) are approximately orthogonal to each other.
Figure 13
Figure 13. Postulated catalytic cycle of EI
Phosphoenolpyruvate (PEP) binds to the EIC domain of free EI (I, this work) leading to a conformational change that results in the formation of the phosphorylated intermediate observed crystallographically (II16). The EIN domain is in the A state conformation in structure I and the B state conformation in structure II. The HPr binding surface on the EINα subdomain of II is fully accessible permitting binding of HPr (structure III). The binding of HPr, together with the dissociation of the product pyruvate, induces reorientation of the EINα/β subdomain through a conformational change in the EIN/EIClinker (residues 255-261) resulting in the formation of a second intermediate (IV) in which the EIN domain remains in the B state conformation but the orientation of the EINα/β subdomain relative to EIC is the same as that found in free EI or the EI-HPr complex. Since there are very limited contacts between the EINα and EINα/β subdomains in the B state conformation, the EIN domain in structure IV rapidly relaxes to the A state through concerted conformational changes in residues 22-24 and 143-146 located in the linker regions joining the EINα and EINα/β subdomains to generate the structure of the EI-HPr complex observed experimentally (V, this work). Subsequent dissociation of HPr results in minor inward displacement of the EIN domain to form the structure of free EI (I) in which the position of the EIN domain is stabilized by a limited set of contacts with the EIC domain. In the absence of HPr, the phosphorylated intermediate (II), upon dissociation of the product pyruvate, can relax to the free EI conformation (I) via an intermediate IV′, analogous to IV but without HPr bound. The three postulated structures, III, IV and IV′, are shown in parentheses. Only a single subunit of EI is displayed. The EIC domain and the EINα and EINα/β subdomains are displayed as red, green and blue molecular surfaces, respectively; the linker helix and linker regions (connecting EINα to EINα/β, and EINα/β to EIC) are shown as orange ribbons; HPr is shown as a purple ribbon.

Similar articles

Cited by

References

    1. Meadow ND, Fox DK, Roseman S. Annu Rev Biochem. 1990;59:497–542. - PubMed
    1. Robillard GT, Broos J. Biochim Biophys Acta. 1999;1422:73–104. - PubMed
    1. Siebold C, Flukiger K, Beutler R, Erni B. FEBS Lett. 2001;504:104–111. - PubMed
    1. Deutscher J, Francke C, Postma PW. Microbiol Mol Biol Rev. 2006;70:939–1031. - PMC - PubMed
    1. Weigel N, Waygood EB, Kukuruzinska MA, Nakazawa A, Roseman S. J Biol Chem. 1982;257:14461–14469. - PubMed

Publication types

MeSH terms

Substances