

Cysteinyl peptide capture for shotgun proteomics: global assessment of chemoselective fractionation
- PMID: 20731415
- PMCID: PMC2948434
- DOI: 10.1021/pr1007015
Cysteinyl peptide capture for shotgun proteomics: global assessment of chemoselective fractionation
Abstract
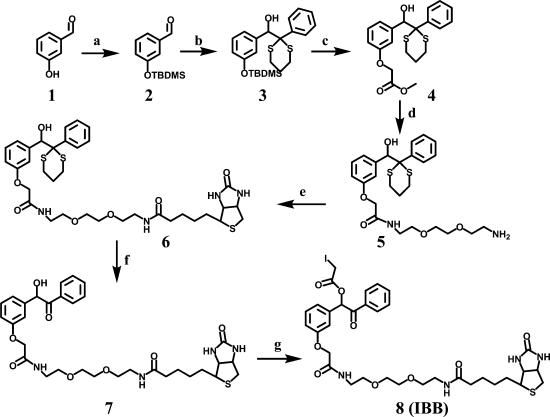
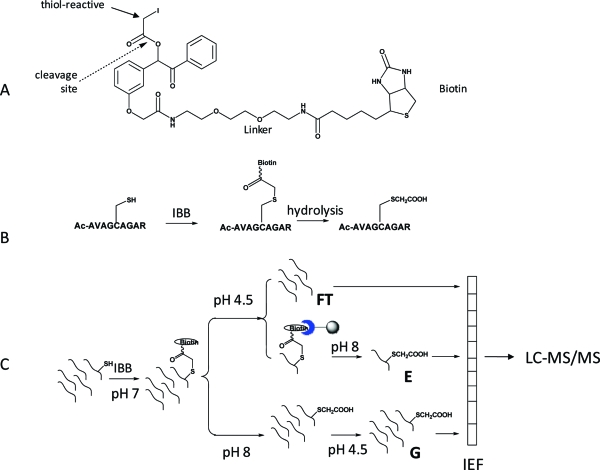
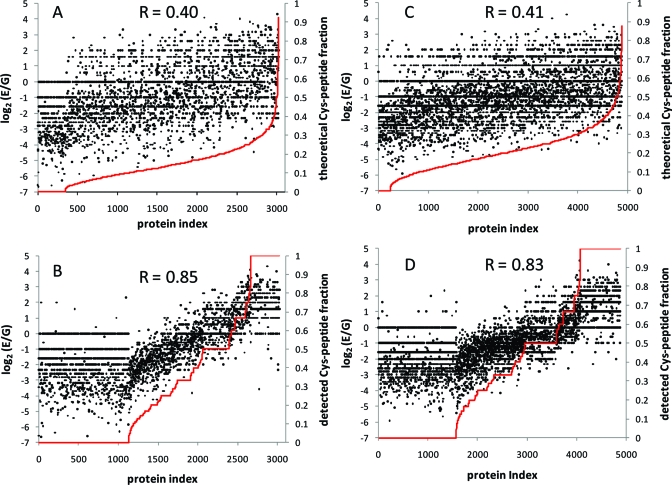
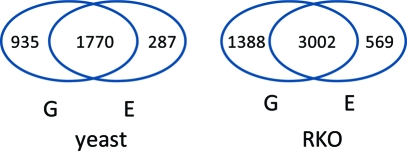
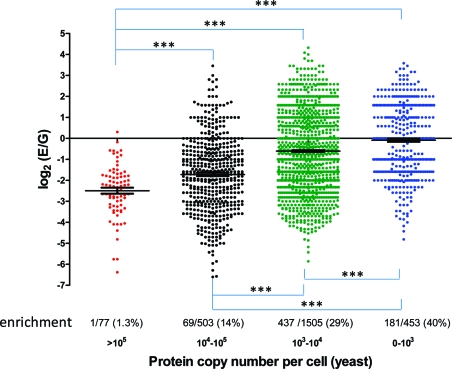
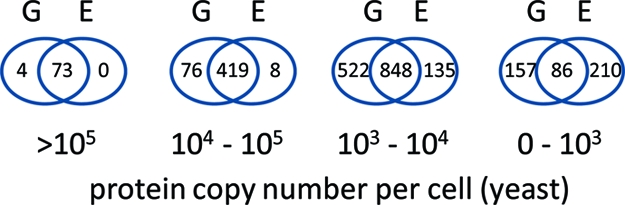
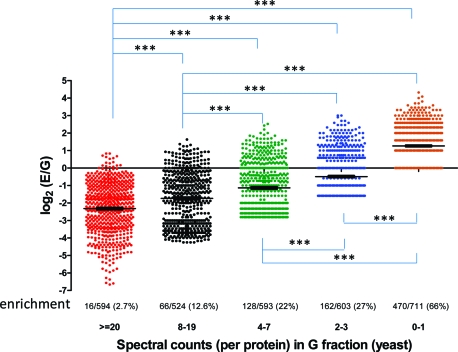
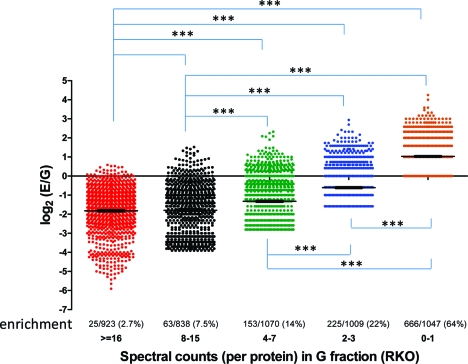
The complexity of cell and tissue proteomes presents one of the most significant technical challenges in proteomic biomarker discovery. Multidimensional liquid chromatography-tandem mass spectrometry (LC-MS/MS)-based shotgun proteomics can be coupled with selective enrichment of cysteinyl peptides (Cys-peptides) to reduce sample complexity and increase proteome coverage. Here we evaluated the impact of Cys-peptide enrichment on global proteomic inventories. We employed a new cleavable thiol-reactive biotinylating probe, N-(2-(2-(2-(2-(3-(1-hydroxy-2-oxo-2-phenylethyl)phenoxy)acetamido)ethoxy)-ethoxy)ethyl)-5-(2-oxohexahydro-1H-thieno[3,4-d]imidazol-4-yl)pentanamide (IBB), to capture Cys-peptides after digestion. Treatment of tryptic digests with the IBB reagent followed by streptavidin capture and mild alkaline hydrolysis releases a highly purified population of Cys-peptides with a residual S-carboxymethyl tag. Isoelectric focusing (IEF) followed by LC-MS/MS of Cys-peptides significantly expanded proteome coverage in Saccharomyces cerevisiae (yeast) and in human colon carcinoma RKO cells. IBB-based fractionation enhanced detection of Cys-proteins in direct proportion to their cysteine content. The degree of enrichment typically was 2-8-fold but ranged up to almost 20-fold for a few proteins. Published copy number annotation for the yeast proteome enabled benchmarking of MS/MS spectral count data to yeast protein abundance and revealed selective enrichment of cysteine-rich, lower abundance proteins. Spectral count data further established this relationship in RKO cells. Enhanced detection of low abundance proteins was due to the chemoselectivity of Cys-peptide capture, rather than simplification of the peptide mixture through fractionation.
Figures


Similar articles
-
[Enrichment strategy of cysteine-containing peptides based on covalent chromatography].Se Pu. 2010 Feb;28(2):108-14. doi: 10.3724/sp.j.1123.2012.00108. Se Pu. 2010. PMID: 20556946 Chinese.
-
Evaluation of strong cation exchange versus isoelectric focusing of peptides for multidimensional liquid chromatography-tandem mass spectrometry.J Proteome Res. 2008 Dec;7(12):5286-94. doi: 10.1021/pr8004666. J Proteome Res. 2008. PMID: 18939861 Free PMC article.
-
Equivalence of protein inventories obtained from formalin-fixed paraffin-embedded and frozen tissue in multidimensional liquid chromatography-tandem mass spectrometry shotgun proteomic analysis.Mol Cell Proteomics. 2009 Aug;8(8):1988-98. doi: 10.1074/mcp.M800518-MCP200. Epub 2009 May 24. Mol Cell Proteomics. 2009. PMID: 19467989 Free PMC article.
-
Proteomics technologies for the global identification and quantification of proteins.Adv Protein Chem Struct Biol. 2010;80:1-44. doi: 10.1016/B978-0-12-381264-3.00001-1. Adv Protein Chem Struct Biol. 2010. PMID: 21109216 Review.
-
Bottom-Up Proteomics: Advancements in Sample Preparation.Int J Mol Sci. 2023 Mar 10;24(6):5350. doi: 10.3390/ijms24065350. Int J Mol Sci. 2023. PMID: 36982423 Free PMC article. Review.
Cited by
-
Optimal conditions for carrying out trypsin digestions on complex proteomes: From bulk samples to single cells.J Proteomics. 2024 Apr 15;297:105109. doi: 10.1016/j.jprot.2024.105109. Epub 2024 Feb 5. J Proteomics. 2024. PMID: 38325732 Free PMC article. Review.
-
Liquid-phase-based separation systems for depletion, prefractionation and enrichment of proteins in biological fluids and matrices for in-depth proteomics analysis--an update covering the period 2008-2011.Electrophoresis. 2012 Jan;33(1):74-88. doi: 10.1002/elps.201100431. Epub 2011 Nov 28. Electrophoresis. 2012. PMID: 22125262 Free PMC article. Review.
-
Catch, Modify and Analyze: Methods of Chemoselective Modification of Cysteine-Containing Peptides.Molecules. 2022 Feb 28;27(5):1601. doi: 10.3390/molecules27051601. Molecules. 2022. PMID: 35268701 Free PMC article. Review.
-
Enrichment of Cysteine-Containing Peptide by On-Resin Capturing and Fixed Charge Tag Derivatization for Sensitive ESI-MS Detection.Molecules. 2020 Mar 18;25(6):1372. doi: 10.3390/molecules25061372. Molecules. 2020. PMID: 32197294 Free PMC article.
-
Mechanism-based inactivation of human cytochrome P450 2B6 by clopidogrel: involvement of both covalent modification of cysteinyl residue 475 and loss of heme.Mol Pharmacol. 2011 Nov;80(5):839-47. doi: 10.1124/mol.111.073783. Epub 2011 Aug 23. Mol Pharmacol. 2011. PMID: 21862689 Free PMC article.
References
-
- Motoyama A.; Yates J. R. Multidimensional LC separations in shotgun proteomics. Anal. Chem. 2008, 80 (19), 7187–93. - PubMed
-
- Gygi S. P.; Rist B.; Gerber S. A.; Turecek F.; Gelb M. H.; Aebersold R. Quantitative analysis of complex protein mixtures using isotope-coded affinity tags. Nat. Biotechnol. 1999, 17 (10), 994–9. - PubMed
-
- Liu T.; Qian W. J.; Chen W. N.; Jacobs J. M.; Moore R. J.; Anderson D. J.; Gritsenko M. A.; Monroe M. E.; Thrall B. D.; Camp D. G. 2nd; Smith R. D. Improved proteome coverage by using high efficiency cysteinyl peptide enrichment: the human mammary epithelial cell proteome. Proteomics 2005, 5 (5), 1263–73. - PMC - PubMed
-
- Gygi S. P.; Rist B.; Griffin T. J.; Eng J.; Aebersold R. Proteome analysis of low-abundance proteins using multidimensional chromatography and isotope-coded affinity tags. J. Proteome Res. 2002, 1 (1), 47–54. - PubMed
-
- Wang H.; Qian W. J.; Chin M. H.; Petyuk V. A.; Barry R. C.; Liu T.; Gritsenko M. A.; Mottaz H. M.; Moore R. J.; Camp D. G. II; Khan A. H.; Smith D. J.; Smith R. D. Characterization of the mouse brain proteome using global proteomic analysis complemented with cysteinyl-peptide enrichment. J. Proteome Res. 2006, 5 (2), 361–9. - PMC - PubMed
Publication types
MeSH terms
Substances
Grants and funding
LinkOut - more resources
Full Text Sources
Molecular Biology Databases
