. 2010 Aug 24;4(8):4559-64.
doi: 10.1021/nn100736c.

In vivo molecular photoacoustic tomography of melanomas targeted by bioconjugated gold nanocages

Affiliations

In vivo molecular photoacoustic tomography of melanomas targeted by bioconjugated gold nanocages

Chulhong Kim et al. ACS Nano. .

Abstract

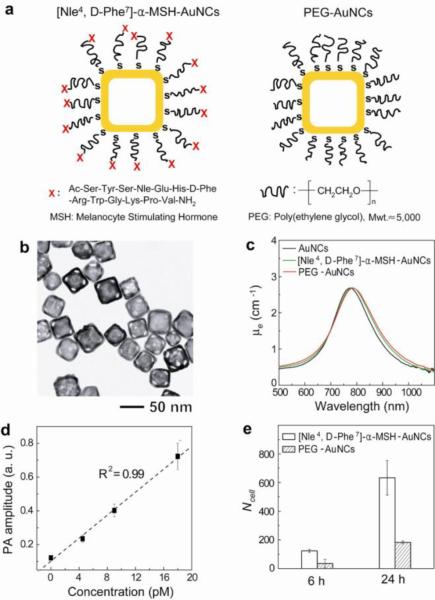
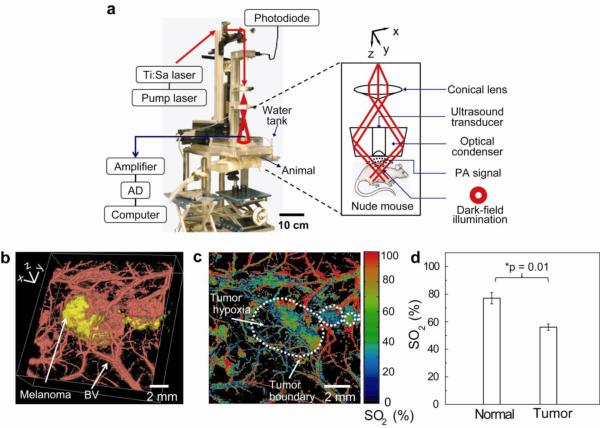
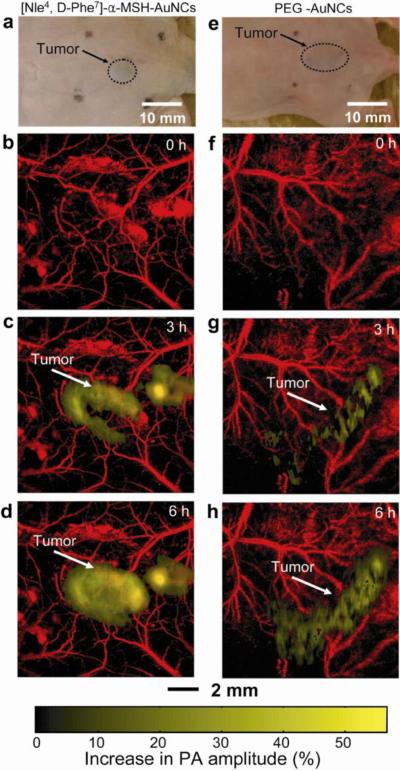
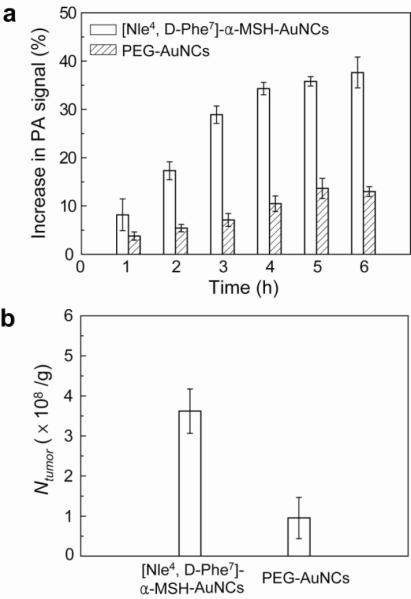
Early diagnosis, accurate staging, and image-guided resection of melanomas remain crucial clinical objectives for improving patient survival and treatment outcomes. Conventional techniques cannot meet this demand because of the low sensitivity, low specificity, poor spatial resolution, shallow penetration, and/or ionizing radiation. Here we overcome such limitations by combining high-resolution photoacoustic tomography (PAT) with extraordinarily optical absorbing gold nanocages (AuNCs). When bioconjugated with [Nle(4),D-Phe(7)]-alpha-melanocyte-stimulating hormone, the AuNCs can serve as a novel contrast agent for in vivo molecular PAT of melanomas with both exquisite sensitivity and high specificity. The bioconjugated AuNCs enhanced contrast approximately 300% more than the control, PEGylated AuNCs. The in vivo PAT quantification of the amount of AuNCs accumulated in melanomas was further validated with inductively coupled plasma mass spectrometry (ICP-MS).


Figures

Figure 1
Figure 1
Schematic, characterization, photoacoustic properties, and cellular uptake of the AuNCs. a, [Nle4,D-Phe7]-α-MSH-AuNCs (left) and PEG-AuNCs (right). b, A typical transmission electron microscopy image of the AuNCs. c, UV-vis-NIR spectra of the AuNCs (18 pM) conjugated with different chemical agents. μe is the extinction coefficient. d, Plot of the PA amplitude as a function of AuNCs concentration. e, In vitro uptake of [Nle4, D-Phe7]-α-MSH-AuNCs and PEG-AuNCs by B16 melanoma cells as determined by ICP-MS. Here Ncell denotes the number of AuNCs per B16 melanoma cell (p = 0.0005 at 6-h and p = 0.007 at 24-h).
Figure 2
Figure 2
Experimental setup of the PA imaging system and noninvasive morphological and functional PA images of B16 melanomas in vivo. a, Photograph of the PA macroscope. The schematic in the dashed box shows a dark-field, confocal configuration. b, Volumetric morphological PA image of B16 melanoma (yellow) and its surrounding blood vessels (red). BV, blood vessels. The melanoma was imaged using the PA macroscope at 778 nm (ultrasonic frequency: 10 MHz), and the surrounding vasculatures were obtained using a PA microscope at 570 nm (ultrasonic frequency: 50 MHz). c, PA MAP mapping of hemoglobin oxygen saturation (SO2) of blood vessels surrounding the melanoma using two optical wavelengths of 564 and 570 nm. The white dotted line shows the tumor boundary. d, Statistical analysis of the average SO2 in normal mice skins and tumor hypoxic area. The average SO2 value in normal mice skins and tumor hypoxic regions are 77±7% and 56±4% and, respectively (p = 0.01 and n = 3 mice for each group).
Figure 3
Figure 3
In vivo noninvasive PA time-course coronal MAP images of B16 melanomas using [Nle4,D-Phe7]-α-MSH- and PEG-AuNCs. a and e, Photographs of nude mice transplanted with B16 melanomas before injection of (a) [Nle4,D-Phe7]-α-MSH- and (e) PEG-AuNCs. b–d and f–h, Time-course PA images of the B16 melanomas after intravenous injection with 100 μL of 10-nM (b–d) [Nle4,D-Phe7]-α-MSH- and (f–h) PEG-AuNCs through the tail vein. The background vasculature images were obtained using the PA microscope at 570 nm (ultrasonic frequency: 50 MHz) and the melanoma images were obtained using the PA macroscope at 778 nm (ultrasonic frequency: 10 MHz). Color schemes: red for blood vessels and yellow for the increase in PA amplitude.
Figure 4
Figure 4
Increase in PA amplitude within the melanomas after intravenous injection of AuNCs and quantification of the AuNCs taken up by the tumors. a, Time-course changes (%) in PA amplitude after intravenous injection of [Nle4,D-Phe7]-α-MSH- and PEG-AuNCs (n = 4 mice for each group). The PA signals increased up to 38 ± 6% for [Nle4,D-Phe7]-α-MSH-AuNCs while the maximum signal increase only reached 13 ± 2% for PEG-AuNCs at a post-injection time of 6 h (p < 0.0001). b, The average number of AuNCs accumulated in the melanomas dissected at 6 h post-injection for the two types of AuNCs as measured by ICP-MS. Here Ntumor denotes the number of AuNCs per unit tumor mass (g). The average number of [Nle4,D-Phe7]-α-MSH-AuNCs per tumor mass (3.6 ± 1.0 × 10⁸ AuNCs/g) was 3.6 times (p = 0.02) that of PEG-AuNCs (1.0 ± 1.0 × 10⁸ AuNCs/g).

References

    1. Srivastava A, Ralhan R, Kaur J. Angiogenesis in Cutaneous Melanoma: Pathogenesis and Clinical Implications. Microsc. Res. Tech. 2003;60:208–224. - PubMed
    1. Shivers SC, Wang X, Li W, Joseph E, Messina J, Glass LF, DeConti R, Cruse CW, Berman C, Fenske NA, et al. Molecular Staging of Malignant Melanoma: Correlation with Clinical Outcome. J. Am. Med. Assoc. 1998;280:1410–1415. - PubMed
    1. Rudin M, Weissleder R. Molecular Imaging in Drug Discovery and Development. Nat. Rev. Drug. Discov. 2003;2:123–131. - PubMed
    1. Gambhir SS. Molecular Imaging of Cancer with Positron Emission Tomography. Nat. Rev. Cancer. 2002;2:683–693. - PubMed
    1. McDonald DM, Choyke PL. Imaging of Angiogenesis: from Microscope to Clinic. Nat. Med. 2003;9:713–725. - PubMed

Publication types