

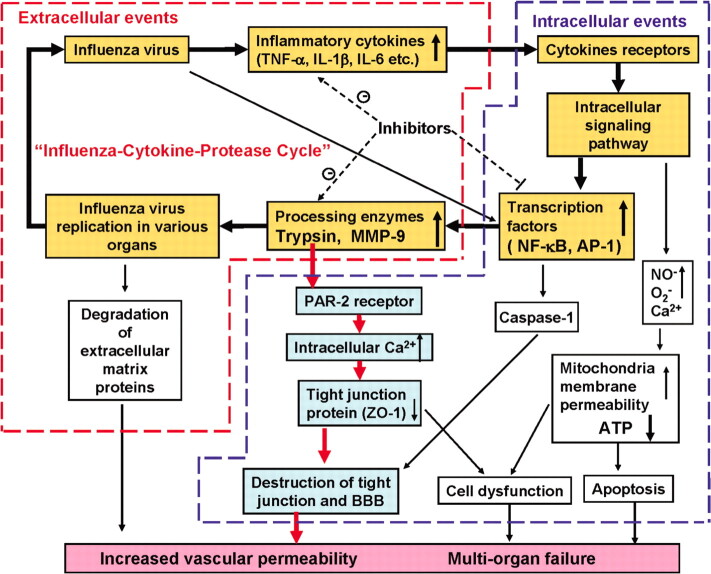
Influenza virus-cytokine-protease cycle in the pathogenesis of vascular hyperpermeability in severe influenza
- PMID: 20731583
- PMCID: PMC7537608
- DOI: 10.1086/656044
Influenza virus-cytokine-protease cycle in the pathogenesis of vascular hyperpermeability in severe influenza
Abstract
Background: Severe influenza is characterized by cytokine storm and multiorgan failure with edema. The aim of this study was to define the impact of the cytokine storm on the pathogenesis of vascular hyperpermeability in severe influenza.
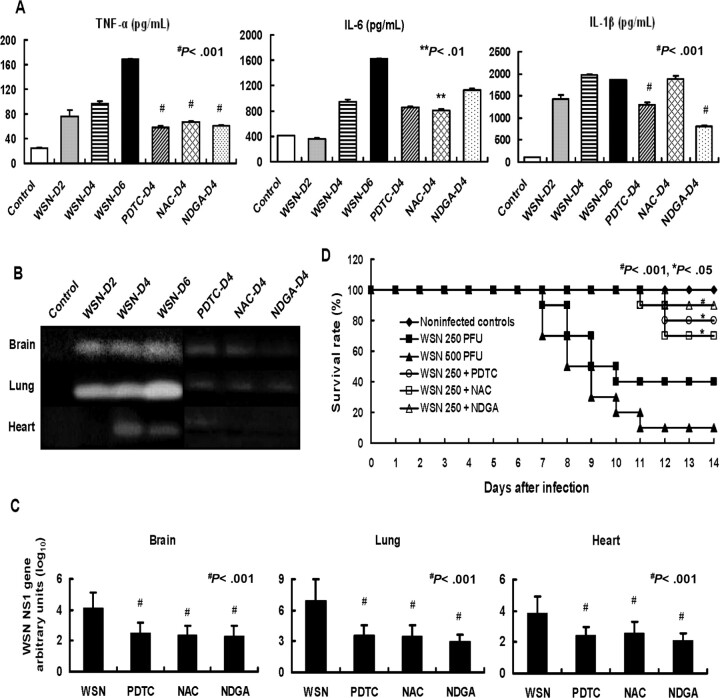
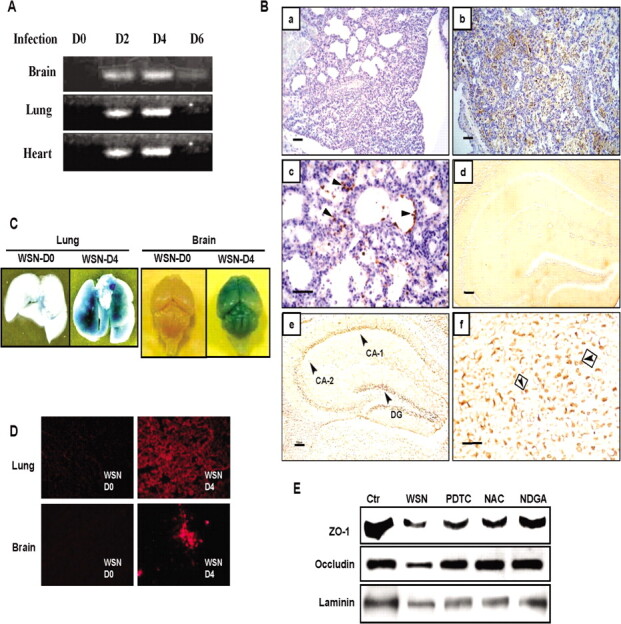
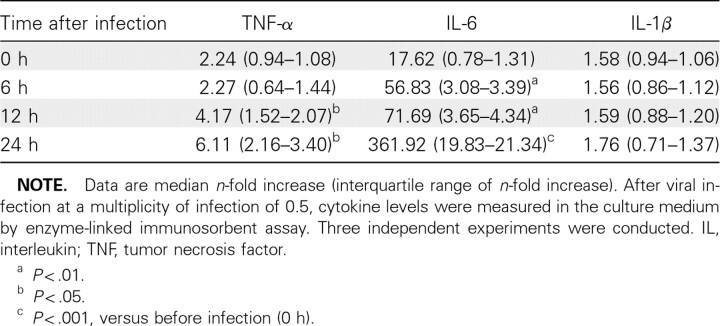
Methods: Weanling mice were infected with influenza A WSN/33(H1N1) virus. The levels of proinflammatory cytokines, tumor necrosis factor (TNF) alpha, interleukin (IL) 6, IL-1beta, and trypsin were analyzed in the lung, brain, heart, and cultured human umbilical vein endothelial cells. The effects of transcriptional inhibitors on cytokine and trypsin expressions and viral replication were determined.
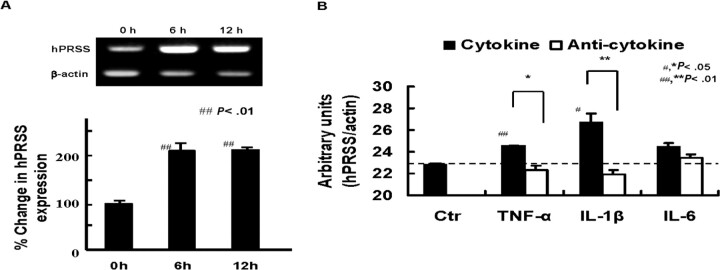
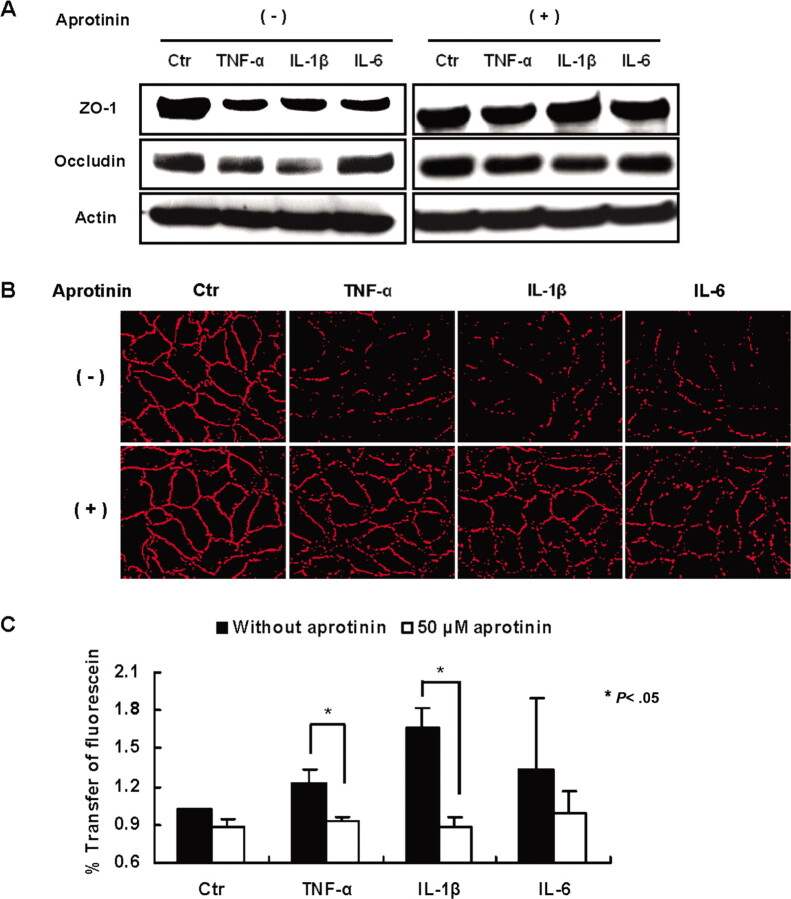
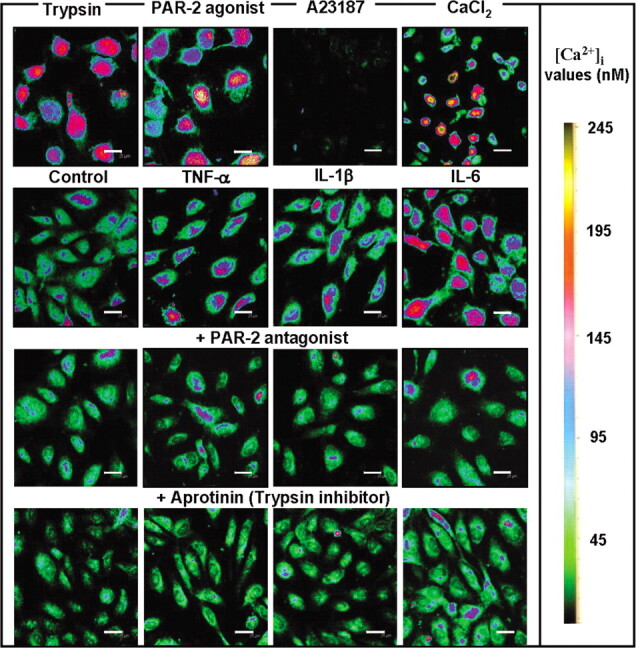
Results: Influenza A virus infection resulted in significant increases in TNF-alpha, IL-6, IL-1beta, viral hemagglutinin-processing protease trypsin levels, and viral replication with vascular hyperpermeability in lung and brain in the first 6 days of infection. Trypsin upregulation was suppressed by transcriptional inhibition of cytokines in vivo and by anti-cytokine antibodies in endothelial cells. Calcium mobilization and loss of tight junction constituent, zonula occludens-1, associated with cytokine- and trypsin-induced endothelial hyperpermeability were inhibited by a protease-activated receptor-2 antagonist and a trypsin inhibitor.
Conclusions: The influenza virus-cytokine-protease cycle is one of the key mechanisms of vascular hyperpermeability in severe influenza.
Conflict of interest statement
Potential conflicts of interest: none reported.
Figures
References
-
- Kim HM, Brandt CD, Arrobio JO, Murphy B, Chanock RM, Parrott RH. Influenza A and B virus infection in infants and young children during the years 1957–1976. Am J Epidemiol. 1979;109:464–79. - PubMed
-
- Dolorme L, Middleton PJ. Influenza A virus associated with acute encephalopathy. Am J Dis Child. 1979;133:822–824. - PubMed
-
- Fujimoto S, Kobayashi M, Uemura O, et al. PCR on cerebrospinal fluid to show influenza-associated acute encephalopathy or encephalitis. Lancet. 1998;352:873–875. - PubMed
-
- Kawada J, Kimura H, Ito Y, et al. Systemic cytokine responses in patients with influenza-associated encephalopathy. J Infect Dis. 2003;188:690–698. - PubMed
Publication types
MeSH terms
Substances
LinkOut - more resources
Full Text Sources
Other Literature Sources
