Review
. 2010 Nov;101(11):2295-301.
doi: 10.1111/j.1349-7006.2010.01681.x.

Global genomic and RNA profiles for novel risk stratification of neuroblastoma

Affiliations
Review

Global genomic and RNA profiles for novel risk stratification of neuroblastoma

Miki Ohira et al. Cancer Sci. 2010 Nov.

Abstract

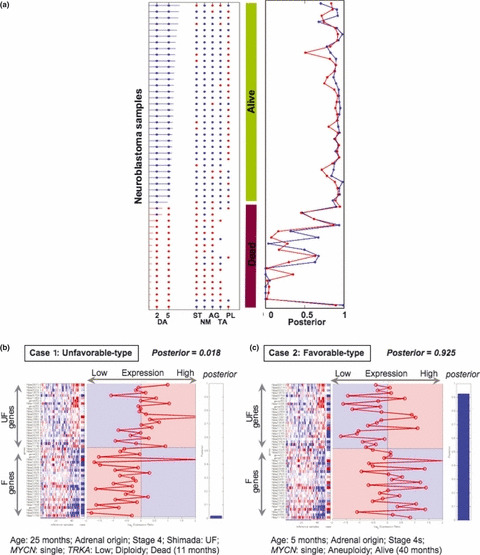
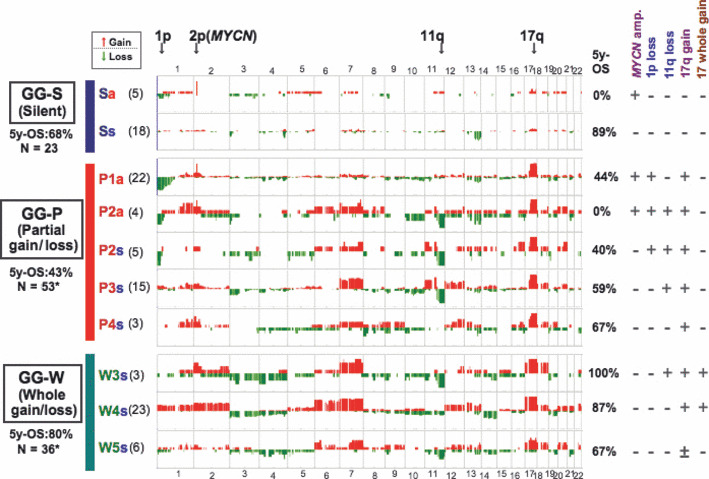
Neuroblastoma is one of the most common solid tumors in children. Its clinical behavior ranges widely from spontaneous regression to life-threatening aggressive growth. The molecular etiology of neuroblastoma is still enigmatic and the overall cure rate of advanced disease is still very poor. Recent microarray-based technology provided us with important information such as comprehensive genomic alterations and gene expression profiles to help us understand the molecular characteristics of each tumor in detail. Several retrospective studies have revealed that these signatures are strongly correlated with patient prognoses and led to the construction of new risk stratification systems, some of which are considered for evaluation in upcoming clinical studies in a prospective way. Large-scale analyses using a variety of genetic tools also discovered a major familial neuroblastoma predisposition gene ALK, as well as new candidate susceptibility genes at 6q22 and 2q35 for sporadic neuroblastoma. Of note, ALK is mutated in 6-9% of sporadic cases, and is either amplified or constitutively activated through mutations mainly within the kinase domain, promoting the possibility of new therapeutic strategies using ALK inhibitors. Additional candidates for outcome predictors such as the methylation phenotype of tumor DNA and expression profiles of microRNA have also been proposed. Such variety of information will help us understand the heterogeneity of neuroblastoma biology and further, the combined use of these signatures will be beneficial in predicting prognosis with high accuracy, as well as choosing a suitable therapy for the individual patient.


Figures

Figure 1
Figure 1
Gene expression profile‐based classifier to predict prognosis of the patient with neuroblastoma. (a) Posterior probability of survival at 5 years for 50 neuroblastomas measured by 200 genes‐diagnostic mini‐chip. Left panel: neuroblastoma samples with clinical information. DA, outcome (red, dead; blue, alive) at 2 years and 5 years after diagnosis; ST, international neuroblastoma staging system (INSS) stage (red, 3 or 4; blue, 1, 2 or 4s); NM, MYCN amplification (red, amplified; blue, not amplified); AG, age at diagnosis (red, ≥1 year; blue, <1 year); TA, TRKA expression (red, low; blue, high); PL, DNA ploidy (red, diploidy; blue, aneuploidy). A red or blue horizontal line denotes the survival period after diagnosis for a dead or alive patient, respectively. Right panel: prediction results when the supervised classifier constructed from 136 training samples is applied to the 50 independent samples (blue). Leave two out cross‐validation analysis using the 50 samples (red). Higher value of posterior means a higher probability of a good prognosis. (b,c) Representative examples of the mini‐chip test. Case 1 predicted as the unfavorable type. Posterior: 0.018. Case 2 predicted as the favorable type. Posterior: 0.925.
Figure 2
Figure 2
Genome alteration‐based risk classification of neuroblastoma. Representative genomic signatures of 112 sporadic neuroblastomas detected by array comparative genomic hybridization (CGH). In this figure, only the major subgroups (sample number in genomic subgroups ≥3) are shown. The panel in the middle shows 20 Mb‐averaged frequencies of gains (upper panel, shown by red lines) and losses (lower panel, shown by green lines) at chromosome locations complementary to bacterial artificial chromosome (BAC) clones in each genomic subgroup. The right panel shows the 5‐year overall survival rates (5y‐OS), as well as the important features of chromosomal events including MYCN amplification, deletions of chromosomes 1p and 11q and gains of chromosome 17q or whole chromosome 17. Genomic groups (GG‐S, GG‐P, and GG‐W) and subgroups (Sa, Ss, etc.) with the sample number involved in each group (N, total sample number in each genomic group; *note that only representative groups are shown) and subgroup (in parenthesis) are also indicated on the left. a, MYCN amplified; s, MYCN non‐amplified. Note that GG‐S, GG‐P and GG‐W corresponded well with the pattern of chromosome 17 abnormalities, namely, no gain of either chromosome 17 or 17q, gain of chromosome 17q and gain of whole chromosome 17, respectively. Subgroup 1 harbors 1p loss but not partial 11q loss. Subgroup 2 has both 1p and 11q losses. Subgroup 3 has partial 11q loss but not 1p loss. Subgroup 4 has no partial 1p and 11q loss. Subgroup GG‐W5 is the exception and has whole chromosomal gains and losses in several chromosomes, but not whole chromosome 17 gain. GG‐W subgroups showed a favorable prognosis, except for two cases with MYCN amplification. Sa is very poor (5y‐OS: 0%), whereas Ss showed favorable prognosis (5y‐OS: 89%). Patients with GG‐P tumors exhibited various survival rates but a lower range, from 0% to 67%; the P2s subgroup (5y‐OS: 40%) had a worse survival rate than P3s (5y‐OS: 59%). It may be that 1p and 11q loss may have a similar impact on patient survival and work additively to the prognosis. Only the P1a subgroup showed a better prognosis among Pa tumors (5y‐OS: 44%). For more detail, see reference .

Similar articles

Cited by

References

    1. Brodeur GM. Neuroblastoma: biological insight into a clinical enigma. Nat Rev Cancer 2003; 3: 203–16. - PubMed
    1. Maris JM. The biologic basis for neuroblastoma heterogeneity and risk stratification. Curr Opin Pediatr 2005; 17: 7–13. - PubMed
    1. Look AT, Hayes FA, Nitschke R, McWilliams NB, Green AA. Cellular DNA content as a predictor of response to chemotherapy in infants with unresectable neuroblastoma. N Engl J Med 1984; 311: 231–5. - PubMed
    1. Schwab M, Alitalo K, Klempnauer KH et al. Amplified DNA with limited homology to myc cellular oncogene is shared by human neuroblastoma cell lines and a neuroblastoma tumour. Nature 1983; 305: 245–8. - PubMed
    1. Brodeur GM, Seeger RC, Schwab M, Varmus HE, Bishop JM. Amplification of N‐myc in untreated human neuroblastomas correlates with advanced disease stage. Science 1984; 224: 1121–4. - PubMed

Substances