. 2010 Oct;32(7):1170-9.
doi: 10.1111/j.1460-9568.2010.07374.x. Epub 2010 Aug 22.

Roles of light and serotonin in the regulation of gastrin-releasing peptide and arginine vasopressin output in the hamster SCN circadian clock

Affiliations

Roles of light and serotonin in the regulation of gastrin-releasing peptide and arginine vasopressin output in the hamster SCN circadian clock

Jessica M Francl et al. Eur J Neurosci. 2010 Oct.

Abstract

Daily timing of the mammalian circadian clock of the suprachiasmatic nucleus (SCN) is regulated by photic input from the retina via the retinohypothalamic tract. This signaling is mediated by glutamate, which activates SCN retinorecipient units communicating to pacemaker cells in part through the release of gastrin-releasing peptide (GRP). Efferent signaling from the SCN involves another SCN-containing peptide, arginine vasopressin (AVP). Little is known regarding the mechanisms regulating these peptides, as literature on in vivo peptide release in the SCN is sparse. Here, microdialysis-radioimmunoassay procedures were used to characterize mechanisms controlling GRP and AVP release in the hamster SCN. In animals housed under a 14/10-h light-dark cycle both peptides exhibited daily fluctuations of release, with levels increasing during the morning to peak around midday. Under constant darkness, this pattern persisted for AVP, but rhythmicity was altered for GRP, characterized by a broad plateau throughout the subjective night and early subjective day. Neuronal release of the peptides was confirmed by their suppression with reverse-microdialysis perfusion of calcium blockers and stimulation with depolarizing agents. Reverse-microdialysis perfusion with the 5-HT(1A,7) agonist 8-OH-DPAT ((±)-8-hydroxydipropylaminotetralin hydrobromide) during the day significantly suppressed GRP but had little effect on AVP. Also, perfusion with the glutamate agonist NMDA, or exposure to light at night, increased GRP but did not affect AVP. These analyses reveal distinct daily rhythms of SCN peptidergic activity, with GRP but not AVP release attenuated by serotonergic activation that inhibits photic phase-resetting, and activated by glutamatergic and photic stimulation that mediate this phase-resetting.


Figures

Figure 1
Figure 1
Diagram of the SCN demonstrating location of microdialysis probe tip sites (*) in animals sampled for GRP (top) and AVP (bottom). SCN, suprachiasmatic nucleus; OC, optic chiasma; 3V, third ventricle.
Figure 2
Figure 2
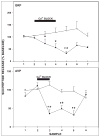
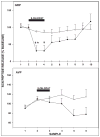
Suppressive effects of reverse-microdialysis perfusion of the SCN with ACSF containing a calcium blocking cocktail (closed circles) on GRP and AVP release. Filled bars represent duration of perfusion. “a”, significantly different from pretreatment baseline (p<0.05); “*”, significantly different from normal ACSF control (open circles; p<0.05). Sampling intervals for GRP and AVP were 30 min and 60 min, respectively. Values are the mean±SEM.
Figure 3
Figure 3
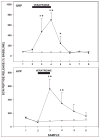
Stimulatory effects of reverse-microdialysis perfusion of the SCN with high [K+] ACSF containing veratridine (closed circles) on GRP and AVP release. Filled bars represent duration of perfusion. “a”, significantly different from pretreatment baseline (p<0.05); “*”, significantly different from normal ACSF control (open circles; p<0.05). Sampling intervals for GRP and AVP were 30 min and 60 min, respectively. Values are the mean±SEM.
Figure 4
Figure 4
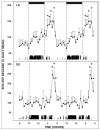
Averaged daily profile of GRP release from the SCN under LD (top) and DD (bottom). The 24 hr profiles are double-plotted to highlight the rhythmic daily profile of this release. Filled bars represent the dark phase under LD. Inserted below each profile is a representative actogram of an animal undergoing the microdialysis sampling. The sampling interval was 1 hr. Data points are the mean±SEM. “*”, p<0.05 vs. non-peak timepoints.
Figure 5
Figure 5
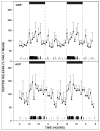
Averaged daily profile of AVP release from the SCN under LD (top) and DD (bottom). The 24 hr profiles are double-plotted to highlight the rhythmic daily profile of this release. Filled bars represent the dark phase under LD. Inserted below each profile is a representative actogram of an animal undergoing the microdialysis sampling. The sampling interval was 1 hr. Data points are the mean±SEM. “*”, p<0.05 vs. non-peak timepoints.
Figure 6
Figure 6
Averaged daily profile of GRP release (top) and AVP release (bottom) of animals with microdialysis probe implant site >500μm from the lateral extent of the SCN. The 24 hr profiles do not exhibit significant daily rhythmicity. Filled bars represent the dark phase. Inserted below each profile is a representative actogram of an animal undergoing the microdialysis sampling. The sampling interval was 1 hr. Data points are the mean±SEM.
Figure 7
Figure 7
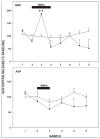
Effects of reverse-microdialysis perfusion of the SCN with ACSF containing 8-OH-DPAT on GRP (perfusion from ZT 6–7) and AVP (perfusion from ZT 0–1) release. Filled bars represent duration of perfusion; “a” significantly different from pretreatment baseline (p<0.05); “*”, significantly different from normal ACSF control (open circles; p<0.05). Sampling intervals for GRP and AVP were 30 min and 60 min, respectively. Values are the mean±SEM.
Figure 8
Figure 8
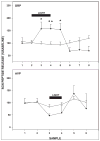
Effects of reverse-microdialysis perfusion of the SCN with ACSF containing NMDA on GRP (perfusion from ZT 13–14) and AVP (perfusion from ZT 18–19) release. Filled bars represent duration of perfusion; “a” significantly different from pretreatment baseline (p<0.05); “*”, significantly different from normal ACSF control (open circles; p<0.05). Sampling intervals for GRP and AVP were 30 min and 60 min, respectively. Values are the mean±SEM.
Figure 9
Figure 9
Effects of a 1 hr light pulse on GRP (ZT 13–14) and AVP (ZT 18–19) release from the SCN. Filled bars represent duration of light pulse; “a” significantly different from pretreatment baseline (p<0.05); “*”, significantly different from normal ACSF control (open circles; p<0.05). Sampling intervals for GRP and AVP were 30 min and 60 min, respectively. Values are the mean±SEM.

Similar articles

Cited by

References

    1. Abe H, Rusak B, Robertson HA. Photic induction of fos protein in the suprachiasmatic nucleus is inhibited by the NMDA receptor antagonist MK-801. Neurosci Lett. 1991;127:9–12. - PubMed
    1. Abe H, Robertson HA, Rusak B. NMDA and non-NMDA receptor antagonists inhibit photic induction of Fos protein in the hamster suprachiasmatic nucleus. Brain Res Bull. 1992;28:831–835. - PubMed
    1. Abrahamson EE, Moore RY. Suprachiasmatic nucleus in the mouse: retinal innervation, intrinsic organization and efferent projections. Brain Res. 2001;916:172–191. - PubMed
    1. Aida R, Moriya T, Araki M, Akiyama M, Wada K, Wada E, Shibata S. Gastrin-releasing peptide mediates photic entrainable signals to dorsal subsets of suprachiasmatic nucleus via induction of Period gene in mice. Mol Pharmacol. 2002;61:26–34. - PubMed
    1. Aioun J, Chambille I, Peytevin J, Martinet L. Neurons containing gastrin-releasing peptide and vasoactive intestinal polypeptide are involved in the reception of the photic signal in the suprachiasmatic nucleus of the Syrian hamster: an immunocytochemical ultrastructural study. Cell Tissue Res. 1998;291:239–253. - PubMed

Publication types

MeSH terms

LinkOut - more resources