. 2011 Feb;10(1):57-68.
doi: 10.1111/j.1601-183X.2010.00640.x. Epub 2010 Oct 5.

Genetic dissection of intermale aggressive behavior in BALB/cJ and A/J mice

Affiliations

Genetic dissection of intermale aggressive behavior in BALB/cJ and A/J mice

H C Dow et al. Genes Brain Behav. 2011 Feb.

Abstract

Aggressive behaviors are disabling, treatment refractory, and sometimes lethal symptoms of several neuropsychiatric disorders. However, currently available treatments for patients are inadequate, and the underlying genetics and neurobiology of aggression is only beginning to be elucidated. Inbred mouse strains are useful for identifying genomic regions, and ultimately the relevant gene variants (alleles) in these regions, that affect mammalian aggressive behaviors, which, in turn, may help to identify neurobiological pathways that mediate aggression. The BALB/cJ inbred mouse strain exhibits relatively high levels of intermale aggressive behaviors and shows multiple brain and behavioral phenotypes relevant to neuropsychiatric syndromes associated with aggression. The A/J strain shows very low levels of aggression. We hypothesized that a cross between BALB/cJ and A/J inbred strains would reveal genomic loci that influence the tendency to initiate intermale aggressive behavior. To identify such loci, we conducted a genomewide scan in an F2 population of 660 male mice bred from BALB/cJ and A/J inbred mouse strains. Three significant loci on chromosomes 5, 10 and 15 that influence aggression were identified. The chromosome 5 and 15 loci are completely novel, and the chromosome 10 locus overlaps an aggression locus mapped in our previous study that used NZB/B1NJ and A/J as progenitor strains. Haplotype analysis of BALB/cJ, NZB/B1NJ and A/J strains showed three positional candidate genes in the chromosome 10 locus. Future studies involving fine genetic mapping of these loci as well as additional candidate gene analysis may lead to an improved biological understanding of mammalian aggressive behaviors.


Figures

Figure 1
Figure 1
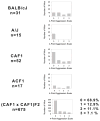
Histograms of aggression scores of BALB/cJ, A/J, CAF1, ACF1, and (CAF1 × CAF1)F2 mice. The x-axis of each histogram shows the aggression score. The y-axis shows the number of mice displaying particular aggression scores. The aggression score corresponded to the number of aggressive attacks over 3 days of testing. A score of 0 signified no attacks over 3 days of testing; a score of 1 signified 1 attack over 3 days of testing; a score of 2 signified 2 attacks over 3 days of testing; and a score of 3 signified 3 attacks over 3 days of testing. A mouse could only have one attack per testing session, because the test was stopped after the initiation of an attack, therefore, 3 was the maximum possible aggression score over 3 days of testing. Aggression phenotype data were not normally distributed, and could not be transformed to a normal distribution using standard transformations. Data were analyzed using nonparametric methods that do not assume a normal distribution.
Figure 2
Figure 2
Results stage 1 (genomewide linkage) and stage 2 (association) of genotypic analysis. In each plot, the x-axis represents a map of all chromosomes in the genome (chromosomes 1–19 and X), and the many vertical marks below the x-axis represent positions of markers genotyped for each chromosome. Vertical dotted lines within the plots represent boundaries between chromosomes. The y-axis represents Lod scores for the test of linkage or the Kruskal-Wallis Rank Sum chi square values for the test of association. In the “Test of Linkage” plot, the dashed horizontal line represents the uncorrected significance threshold (uncorrected P < 0.05 value). In the “Test of Association” plot, the lower dashed horizontal line represents the uncorrected significance threshold (uncorrected P < 0.05 value), and the upper dashed horizontal line represents the Bonferroni corrected significance threshold (Bonferonni corrected P < 0.05 value, corrected for testing at 131 markers). Significant loci were identified on chromosomes 5, 10 and 15 in the association analysis.
Figure 3
Figure 3
Interval analysis. Interval mapping results are shown for the chromosome 5, 10, and 15 loci obtained with the R/qtl program (Broman et al., 2003), using the nonparametric methods and treating the aggression scores (0–3) as the phenotypes. To determine the LOD score significance thresholds for the three loci identified, we performed 1,000 permutations of the aggression scores, and, for each permutation, we obtained the maximum LOD scores across all three chromosomes. We then obtained the value of the 95th percentile of these maximum LOD scores, 2.64, as our LOD score threshold at the adjusted significance threshold level of 5%. Based on 1,000 bootstrap analysis, the 95% confidence intervals for each locus are the following: chromosome 5, 0–144.4 Mb; chromosome 10, 117.3–122.3 Mb; chromosome 15, 41.1–112.5 Mb.
Figure 4
Figure 4
Haplotype analysis. A graphical summary of haplotype blocks identified on chromosomes 5, 10, and 15 is shown. The intervals (horizontal lines) shown for each chromosome represent the 95% confidence intervals for each locus--that is, 0 to 144,379,186 bp on chromosome 5; 117,338,390 – 122,256,160 bp on chromosome 10; and 41,069,371–112,453,477 bp on chromosome 15. The small, vertical lines or blocks represent the haplotype blocks identified using the 10 consecutive SNP haplotype block analysis for each chromosome. The percent of each chromosomal interval that is encompassed by the summed length of the haplotype blocks for that chromosome is shown in parentheses after each chromosome name. Note that the intervals shown here for chromosomes 10 and 15 are smaller than the intervals for those chromosomes shown in Tables S5 and S6.

Similar articles

Cited by

References

    1. Appelbaum PS. Violence and mental disorders: data and public policy. American Journal of Psychiatry. 2006;163:1319–1321. - PubMed
    1. Beitchman JH, Baldassarra L, Mik H, De Luca V, King N, Bender D, Ehtesham S, Kennedy JL. Serotonin transporter polymorphisms and persistent, pervasive childhood aggression. American Journal of Psychiatry. 2006;163:1103–1105. - PubMed
    1. Boulton E, Cole C, Knight A, Cleary H, Snowden R, Plumb M. Low-penetrance genetic susceptibility and resistance loci implicated in the relative risk for radiation-induced acute myeloid leukemia in mice. Blood. 2003;101:2349–2354. - PubMed
    1. Bouwknecht JA, Paylor R. Behavioral and physiological mouse assays for anxiety: a survey in nine mouse strains. Behavioural Brain Research. 2002;136:489–501. - PubMed
    1. Brodkin ES. BALB/c mice: low sociability and other phenotypes that may be relevant to autism. Behavioural Brain Research (special issue "Animal Models for Autism") 2007;176:53–65. - PubMed

Publication types