

A dynamic noise level algorithm for spectral screening of peptide MS/MS spectra
- PMID: 20731867
- PMCID: PMC2939612
- DOI: 10.1186/1471-2105-11-436
A dynamic noise level algorithm for spectral screening of peptide MS/MS spectra
Abstract
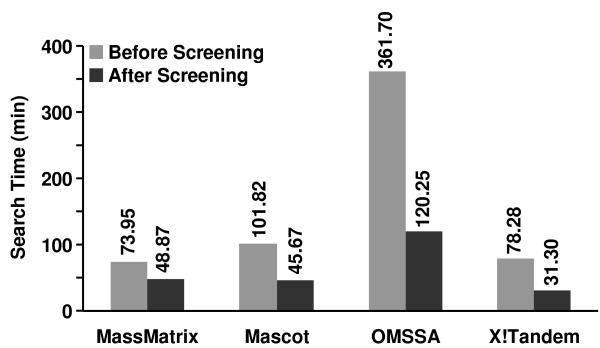
Background: High-throughput shotgun proteomics data contain a significant number of spectra from non-peptide ions or spectra of too poor quality to obtain highly confident peptide identifications. These spectra cannot be identified with any positive peptide matches in some database search programs or are identified with false positives in others. Removing these spectra can improve the database search results and lower computational expense.
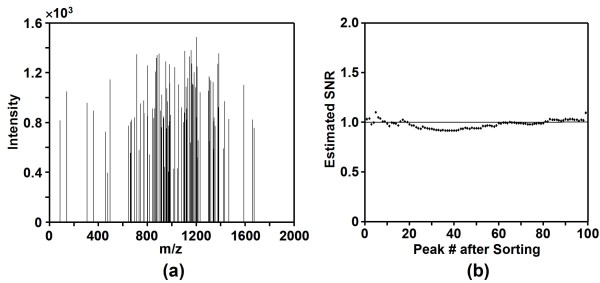
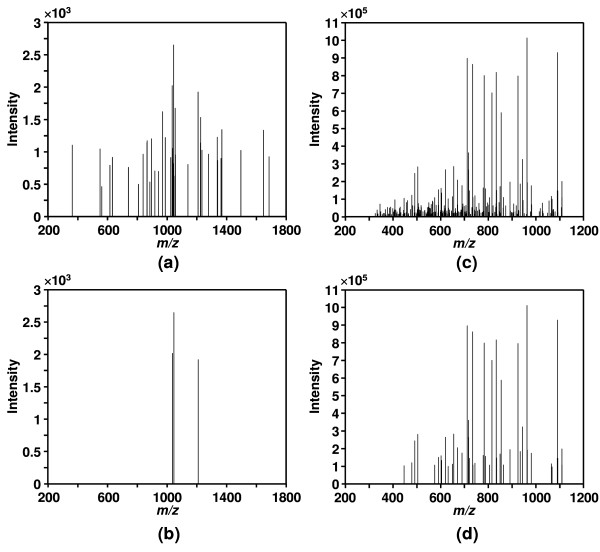
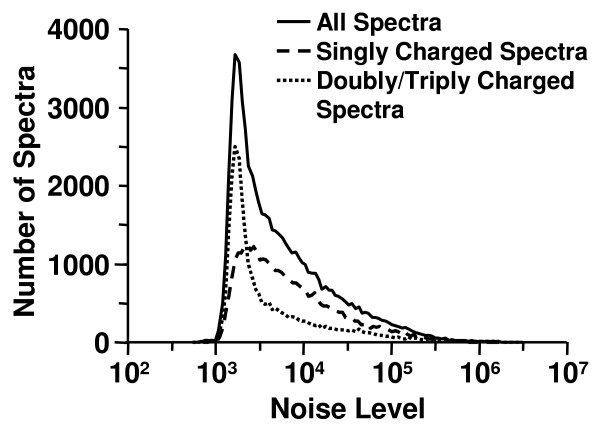
Results: A new algorithm has been developed to filter tandem mass spectra of poor quality from shotgun proteomic experiments. The algorithm determines the noise level dynamically and independently for each spectrum in a tandem mass spectrometric data set. Spectra are filtered based on a minimum number of required signal peaks with a signal-to-noise ratio of 2. The algorithm was tested with 23 sample data sets containing 62,117 total spectra.
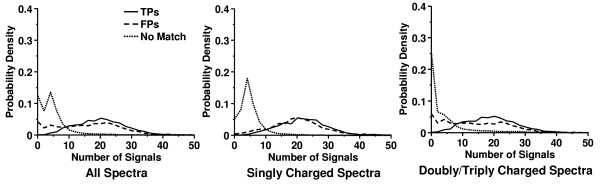
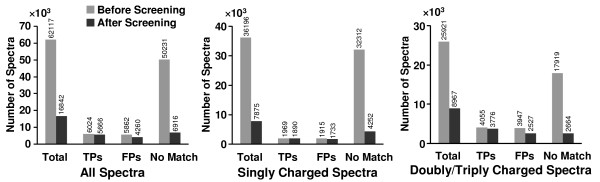
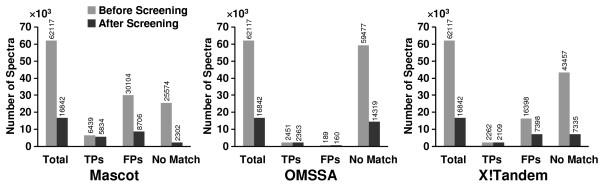
Conclusions: The spectral screening removed 89.0% of the tandem mass spectra that did not yield a peptide match when searched with the MassMatrix database search software. Only 6.0% of tandem mass spectra that yielded peptide matches considered to be true positive matches were lost after spectral screening. The algorithm was found to be very effective at removal of unidentified spectra in other database search programs including Mascot, OMSSA, and X!Tandem (75.93%-91.00%) with a small loss (3.59%-9.40%) of true positive matches.
Figures

Similar articles
-
A hierarchical MS2/MS3 database search algorithm for automated analysis of phosphopeptide tandem mass spectra.Proteomics. 2009 Apr;9(7):1763-70. doi: 10.1002/pmic.200800282. Proteomics. 2009. PMID: 19288523 Free PMC article.
-
High-throughput database search and large-scale negative polarity liquid chromatography-tandem mass spectrometry with ultraviolet photodissociation for complex proteomic samples.Mol Cell Proteomics. 2013 Sep;12(9):2604-14. doi: 10.1074/mcp.O113.028258. Epub 2013 May 21. Mol Cell Proteomics. 2013. PMID: 23695934 Free PMC article.
-
MassMatrix: a database search program for rapid characterization of proteins and peptides from tandem mass spectrometry data.Proteomics. 2009 Mar;9(6):1548-55. doi: 10.1002/pmic.200700322. Proteomics. 2009. PMID: 19235167 Free PMC article.
-
The spectral networks paradigm in high throughput mass spectrometry.Mol Biosyst. 2012 Oct;8(10):2535-44. doi: 10.1039/c2mb25085c. Mol Biosyst. 2012. PMID: 22610447 Free PMC article. Review.
-
Current algorithmic solutions for peptide-based proteomics data generation and identification.Curr Opin Biotechnol. 2013 Feb;24(1):31-8. doi: 10.1016/j.copbio.2012.10.013. Epub 2012 Nov 8. Curr Opin Biotechnol. 2013. PMID: 23142544 Free PMC article. Review.
Cited by
-
compMS2Miner: An Automatable Metabolite Identification, Visualization, and Data-Sharing R Package for High-Resolution LC-MS Data Sets.Anal Chem. 2017 Apr 4;89(7):3919-3928. doi: 10.1021/acs.analchem.6b02394. Epub 2017 Mar 27. Anal Chem. 2017. PMID: 28225587 Free PMC article.
-
Denoising Search doubles the number of metabolite and exposome annotations in human plasma using an Orbitrap Astral mass spectrometer.Res Sq [Preprint]. 2024 Jul 25:rs.3.rs-4758843. doi: 10.21203/rs.3.rs-4758843/v1. Res Sq. 2024. Update in: Nat Methods. 2025 May;22(5):1008-1016. doi: 10.1038/s41592-025-02646-x. PMID: 39108483 Free PMC article. Updated. Preprint.
-
Top-Down Protein Analysis by Tandem-Trapped Ion Mobility Spectrometry/Mass Spectrometry (Tandem-TIMS/MS) Coupled with Ultraviolet Photodissociation (UVPD) and Parallel Accumulation/Serial Fragmentation (PASEF) MS/MS Analysis.J Am Soc Mass Spectrom. 2023 Oct 4;34(10):2232-2246. doi: 10.1021/jasms.3c00187. Epub 2023 Aug 28. J Am Soc Mass Spectrom. 2023. PMID: 37638640 Free PMC article.
-
Filtering of MS/MS data for peptide identification.BMC Genomics. 2013;14 Suppl 7(Suppl 7):S2. doi: 10.1186/1471-2164-14-S7-S2. Epub 2013 Nov 5. BMC Genomics. 2013. PMID: 24564329 Free PMC article.
-
How activating mutations affect MEK1 regulation and function.J Biol Chem. 2017 Nov 17;292(46):18814-18820. doi: 10.1074/jbc.C117.806067. Epub 2017 Oct 10. J Biol Chem. 2017. PMID: 29018093 Free PMC article.
References
Publication types
MeSH terms
Substances
Grants and funding
LinkOut - more resources
Full Text Sources
