. 2010 Oct 29;285(44):33843-57.
doi: 10.1074/jbc.M110.153197. Epub 2010 Aug 23.

Effects of endoplasmic reticulum stress on group VIA phospholipase A2 in beta cells include tyrosine phosphorylation and increased association with calnexin

Affiliations

Effects of endoplasmic reticulum stress on group VIA phospholipase A2 in beta cells include tyrosine phosphorylation and increased association with calnexin

Haowei Song et al. J Biol Chem. .

Abstract

The Group VIA phospholipase A(2) (iPLA(2)β) hydrolyzes glycerophospholipids at the sn-2-position to yield a free fatty acid and a 2-lysophospholipid, and iPLA(2)β has been reported to participate in apoptosis, phospholipid remodeling, insulin secretion, transcriptional regulation, and other processes. Induction of endoplasmic reticulum (ER) stress in β-cells and vascular myocytes with SERCA inhibitors activates iPLA(2)β, resulting in hydrolysis of arachidonic acid from membrane phospholipids, by a mechanism that is not well understood. Regulatory proteins interact with iPLA(2)β, including the Ca(2+)/calmodulin-dependent protein kinase IIβ, and we have characterized the iPLA(2)β interactome further using affinity capture and LC/electrospray ionization/MS/MS. An iPLA(2)β-FLAG fusion protein was expressed in an INS-1 insulinoma cell line and then adsorbed to an anti-FLAG matrix after cell lysis. iPLA(2)β and any associated proteins were then displaced with FLAG peptide and analyzed by SDS-PAGE. Gel sections were digested with trypsin, and the resultant peptide mixtures were analyzed by LC/MS/MS with database searching. This identified 37 proteins that associate with iPLA(2)β, and nearly half of them reside in ER or mitochondria. They include the ER chaperone calnexin, whose association with iPLA(2)β increases upon induction of ER stress. Phosphorylation of iPLA(2)β at Tyr(616) also occurs upon induction of ER stress, and the phosphoprotein associates with calnexin. The activity of iPLA(2)β in vitro increases upon co-incubation with calnexin, and overexpression of calnexin in INS-1 cells results in augmentation of ER stress-induced, iPLA(2)β-catalyzed hydrolysis of arachidonic acid from membrane phospholipids, reflecting the functional significance of the interaction. Similar results were obtained with mouse pancreatic islets.


Figures
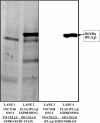
FIGURE 1.
FIGURE 1.
Expression of FLAG-iPLA2β in INS-1 cells, followed by affinity capture, desorption, and SDS-PAGE analysis. INS-1 cells were stably transfected with lentivirus vector only (lanes 1 and 3) or with vector containing cDNA encoding FLAG-iPLA2β (lanes 2 and 4) with the tag at the C terminus as described under “Experimental Procedures.” After incubation, cells were lysed, and the lysates were incubated with FLAG affinity resin and washed. Adsorbed proteins were then eluted and analyzed by 10% SDS-PAGE. Protein bands in lanes 1 and 2 were visualized with SYPRO Ruby stain. Lanes 3 and 4 represent immunoblots probed with antibody directed against iPLA2β.
FIGURE 2.
FIGURE 2.
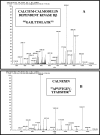
Tandem mass spectra of tryptic peptides from calcium/calmodulin-dependent protein kinase IIβ (A) and from calnexin (B) observed in LC/MS/MS analyses of digests of FLAG-iPLA2β and interacting proteins from INS-1 cells. FLAG-iPLA2β and interacting proteins were generated, isolated, digested, and analyzed by LC/MS/MS as in Fig. 1. The tandem spectrum of one of four observed tryptic peptides from the sequence of calcium/calmodulin-dependent protein kinase IIβ is illustrated in A, and the tandem spectrum of one of three observed tryptic peptides from calnexin is illustrated in B.
FIGURE 3.
FIGURE 3.
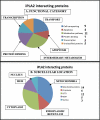
Summary of iPLA2β-interacting proteins in INS-1 cells that overexpress FLAG-iPLA2β identified by affinity capture, SDS-PAGE, and LC/MS/MS. FLAG-iPLA2β and interacting proteins were generated in INS-1 cells, affinity-captured, and analyzed by SDS-PAGE as in Fig. 1. Gels were sectioned, in situ tryptic digestion was performed, and the digests were analyzed by LC/MS/MS with database searching as described under “Experimental Procedures.” A, functional category; B, subcellular localization. The displayed results represent a summary of three separate experiments.
FIGURE 4.
FIGURE 4.
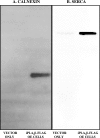
Immunochemical verification of the identities of iPLA2β-interacting proteins identified by LC/MS/MS analyses. FLAG-iPLA2β and interacting proteins were generated in INS-1 cells, affinity-captured, and analyzed by SDS-PAGE as in Fig. 1. Immunoblotting was then performed with antibodies directed against calnexin (A) or SERCA (B) as described under “Experimental Procedures.” Displayed results are representative of three separate experiments.
FIGURE 5.
FIGURE 5.
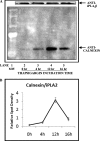
Induction of ER stress with thapsigargin increases the association of calnexin with iPLA2β in INS-1 cells that overexpress FLAG-iPLA2β. INS-1 cells stably transfected to overexpress FLAG-iPLA2β were incubated for various intervals with 1 μm thapsigargin and then lysed. Lysates were processed as in Fig. 1 to capture FLAG-iPLA2β and associated proteins, which were then analyzed by SDS-PAGE. In A, immunoblotting was then performed with antibodies directed against calnexin, and, after stripping and reprobing, for iPLA2β. B represents a plot of the densitometric ratios for calnexin over iPLA2β as a function of incubation time with thapsigargin. The displayed results are representative of three separate experiments.
FIGURE 6.
FIGURE 6.
Induction of ER stress with thapsigargin increases the association of iPLA2β with calnexin in INS-1 cells that overexpress His-calnexin. INS-1 cells were stably transfected to overexpress His-calnexin. In A, cells were lysed and applied to cobalt affinity columns (LOAD, lane 1), which were then washed (VOID, lane 2). His-calnexin and associated proteins were then desorbed (ELUTE, lane 3) and analyzed by SDS-PAGE as in Fig. 1. Immunoblotting was then performed with anti-calnexin antibody. In B, INS-1 cells that overexpressed His-calnexin were incubated for various intervals with thapsigargin, and lysates were then processed as in A. Immunoblots were probed with anti iPLA2β antibody and then stripped and reprobed with anti-calnexin antibody (inset in B). Displayed results are representative of three separate experiments.
FIGURE 7.
FIGURE 7.
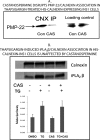
The glucosidase inhibitor castanospermine disrupts association of calnexin with PMP-22 but not with iPLA2β in thapsigargin-treated INS-1 cells that express His-calnexin. INS-1 cells were stably transfected to overexpress His-calnexin. In A, cells were incubated with vehicle (DMSO; Con) or with castanospermine (1 mm; CAS) and then incubated with thapsigargin and processed as in Fig. 6. Immunoblots from SDS-PAGE analyses were probed with antibody directed against PMP-22. The two leftmost lanes reflect Western blots of SDS-PAGE analyses of the immunoprecipitate obtained with the anti-calnexin antibody (CNX IP). The two rightmost lanes are loading controls on which no immunoprecipitation was performed before SDS-PAGE and Western blotting with the antibody against PMP-22. In B, experiments were performed in a similar manner, except that immunoblots were probed with antibody directed against iPLA2β and then stripped and reprobed with antibody directed against calnexin. Densitometric ratios of signals contained with the two antibodies were computed and plotted in the histogram in the lower portion of B. Displayed results are representative of three separate experiments. TG, thapsigargin.
FIGURE 8.
FIGURE 8.
Influence of ATP and chelation of Ca2+ with EGTA on association of calnexin and iPLA2β. INS-1 cells stably transfected to overexpress FLAG-iPLA2β were incubated for various intervals with 1 μm thapsigargin and then lysed as in Fig. 5, and lysates were then incubated with no additions (lanes 1 in A and B), with 5 mm EGTA (lanes 2 in A and B), or with 1 mm ATP (lanes 3 in A and B). The lysates were then processed as in Fig. 5 to capture FLAG-iPLA2β and associated proteins, which were then analyzed by SDS-PAGE. Immunoblotting was then performed with antibodies directed against calnexin (A), and blots were then stripped and reprobed with antibodies directed against iPLA2β (B). Displayed results are representative of three separate experiments.
FIGURE 9.
FIGURE 9.
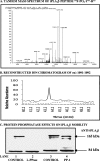
Identification of a phosphotyrosine residue in iPLA2β after thapsigargin treatment of His-calnexin-INS1 cells. INS-1 cells were stably transfected to overexpress His-calnexin and incubated with thapsigargin or vehicle as in Fig. 6. The cells were then lysed, and the lysates were passed over cobalt affinity columns to capture and then elute His-calnexin and associated proteins, including iPLA2β. Eluates were processed by SDS-PAGE and tryptic digestion, and digests were analyzed by LC/MS/MS, as in Fig. 3. A, tandem spectrum of a tryptic peptide (595FLDGGLLANNPTLDAMTEIHEYNQDMIR62) from the iPLA2β sequence in which Tyr616 is phosphorylated that was obtained from materials in a thapsigargin-treated cell lysate. B, reconstructed ion chromatogram for the [M + 3H]3+ ion (m/z 1091–1092) of that peptide from LC/MS analyses of tryptic digests. Solid line, thapsigargin-treated cells; dashed line, vehicle-treated cells. C, immunoblots from SDS-PAGE analyses of cobalt column eluates obtained from thapsigargin-treated cells. The eluates in lanes 1 and 3 (CONTROL) were not treated with phosphatase. The eluates in lanes 2 and 4 were treated with λ-protein phosphatase (λ-PPase) and protein phosphatase-1 (PP-1), respectively, before SDS-PAGE analyses. The blots were probed with antibody directed against iPLA2β. Displayed results are representative of three separate experiments.
FIGURE 10.
FIGURE 10.
Effects of calnexin on Group VIB phospholipase A2 (iPLA2β) activity. The source of iPLA2β was the imidazole eluate from cobalt immobilized metal affinity columns onto which lysates of INS-1 cells that overexpress His-tagged iPLA2β had been applied. Calnexin (CNX) was prepared in a similar manner with INS-1 cells that overexpress His-calnexin. ATP (10 mm) and/or BEL (1 μm) were included in the incubation medium where indicated. Incubations were performed for 30 min at 37 °C, and PLA2 activity was measured as described under “Experimental Procedures.” Mean values are displayed, and S.E. values are indicated (error bars) (n = 6). *, significantly (p < 0.05) higher value for the condition in question and the “iPLA2β” condition, in which only iPLA2β and substrate and no calnexin, ATP, or BEL were added to the incubation medium. X denotes a significantly lower value for the condition in question and the “iPLA2β” condition. A plus sign denotes a significant difference for the values of the parameter of interest with and without calnexin. The p value for the difference between the conditions “iPLA2β” and “iPLA2β + CNX” is 0.0027, and that between “iPLA2β + ATP” and “iPLA2β + ATP” is 0.026.
FIGURE 11.
FIGURE 11.
Effects of calnexin Overexpression on ER stress-induced release of [3H]arachidonic acid from prelabeled cells. INS-1 cells that had been stably transfected with a lentivirus vector construct that caused them to overexpress His-calnexin (CNX-OE; dark bars) and cells transfected with empty vector only (VECTOR, light bars) were prelabeled by incubation (5 × 10⁵ cells/well, 20 h, 37 °C) with [3H]arachidonic acid (final concentration 0.5 μCi/ml and 5 nm). To remove unincorporated radiolabel, the cells were incubated (1 h) in serum-free medium and then washed three times with glucose-free RPMI 1640 medium. Labeled cells were incubated in RPMI 1640 medium (0.5% BSA, 37 °C, 20 min) containing BEL (10 μm) or DMSO vehicle. After removal of that medium, the cells were placed in RPMI 1640 medium with 0.5% BSA that contained thapsigargin (THAPS; 1 μm) or vehicle (CONTROL or CON) and incubated (37 °C, 2 h). The cells were then collected by centrifugation, and the 3H content of the supernatant was measured by liquid scintillation spectrometry, as described under “Experimental Procedures” and elsewhere (28). The amounts of released 3H were expressed as a percentage of incorporated 3H and then normalized to the value for the vector control condition. Mean values are displayed, and S.E. values (n = 6) are indicated (error bars). *, significant difference (p < 0.05). The p values for the difference between the thapsigargin condition and the other conditions were 0.020 (versus control), 0.024 (versus control + BEL), and 0.025 (versus thapsigargin + BEL), respectively.
FIGURE 12.
FIGURE 12.
Release of [3H]arachidonic acid from prelabeled pancreatic islets subjected to ER stress with ionophore A23187 and EGTA. Pancreatic islets isolated from mice were incubated with [3H]arachidonic acid (1 μCi, 20 h) and washed free of unincorporated radiolabel as described under “Experimental Procedures.” The islets were then divided into aliquots that were preincubated with vehicle (left and center bar) or BEL (10 μm; right bar). After removal of the preincubation medium and washing, islets were incubated with DMSO in Ca2+-replete medium (CONTROL) or with ionophore A23187 (10 μm) in buffer containing EGTA (0.5 mm, right and center bars). The 3H content of the supernatant was measured by liquid scintillation spectrometry, as in Fig. 11, and amounts of released 3H were expressed as a percentage of incorporated 3H for each condition. Results are expressed as mean ± S.E. (error bars) (n = 7). *, significant difference (p < 0.05) from the control value.
FIGURE 13.
FIGURE 13.
Co-Immunoprecipitation of iPLA2β and calnexin from pancreatic islets isolated from mice. In A, pancreatic islets (∼1250) were isolated from C57BL/6J wild-type mice and subjected to ER stress as in Fig. 12. A lysate was then prepared in immunoprecipitation buffer containing 2% CHAPS. The lysate was divided into two aliquots, and one was incubated with Protein A-agarose and 20 μl of fetal bovine serum (20 μl) as a control (CON). The other aliquot was incubated with Protein A-agarose and a rabbit antibody (20 μl) directed against iPLA2β to effect immunoprecipitation (IP). The resultant immunoprecipitate was then analyzed by SDS-PAGE, transferred to PVDF membrane, and probed with rabbit antibody directed against calnexin (upper panel). After stripping, the blot was then probed with goat antibody directed against iPLA2β (middle panel). The lower panel represents a loading control probed with anti-calnexin antibody. In B, islets (∼1160) were isolated from RIP-iPLA2β-transgenic mice (30) and lysed as above, and the lysate was divided into two aliquots, one of which was incubated with Protein A-agarose and fetal bovine serum as control (CON). The other was incubated with Protein A-agarose and rabbit anti-calnexin antibody (rabbit). The resultant immunoprecipitate (IP) was analyzed by SDS-PAGE, transferred to a PVDF membrane, and probed with T-14 antibody directed against iPLA2β (upper panel). After stripping, the blot was probed with mouse anti-calnexin antibody (middle panel). The lower panel represents a loading probed with T-14 anti-iPLA2β antibody. Displayed results are representative of three independent experiments. MW, molecular weight standards.

Similar articles

Cited by

References

    1. Tang J., Kriz R. W., Wolfman N., Shaffer M., Seehra J., Jones S. S. (1997) J. Biol. Chem. 272, 8567–8575 - PubMed
    1. Balboa M. A., Balsinde J., Jones S. S., Dennis E. A. (1997) J. Biol. Chem. 272, 8576–8580 - PubMed
    1. Ma Z., Ramanadham S., Kempe K., Chi X. S., Ladenson J., Turk J. (1997) J. Biol. Chem. 272, 11118–11127 - PubMed
    1. Yang H. C., Mosior M., Ni B., Dennis E. A. (1999) J. Neurochem. 73, 1278–1287 - PubMed
    1. Ma Z., Wang X., Nowatzke W., Ramanadham S., Turk J. (1999) J. Biol. Chem. 274, 9607–9616 - PMC - PubMed

Publication types

LinkOut - more resources