. 2010 Oct 29;285(44):34072-85.
doi: 10.1074/jbc.M110.137380. Epub 2010 Aug 23.

Activated PKC{delta} and PKC{epsilon} inhibit epithelial chloride secretion response to cAMP via inducing internalization of the Na+-K+-2Cl- cotransporter NKCC1

Affiliations

Activated PKC{delta} and PKC{epsilon} inhibit epithelial chloride secretion response to cAMP via inducing internalization of the Na+-K+-2Cl- cotransporter NKCC1

Jun Tang et al. J Biol Chem. .

Abstract

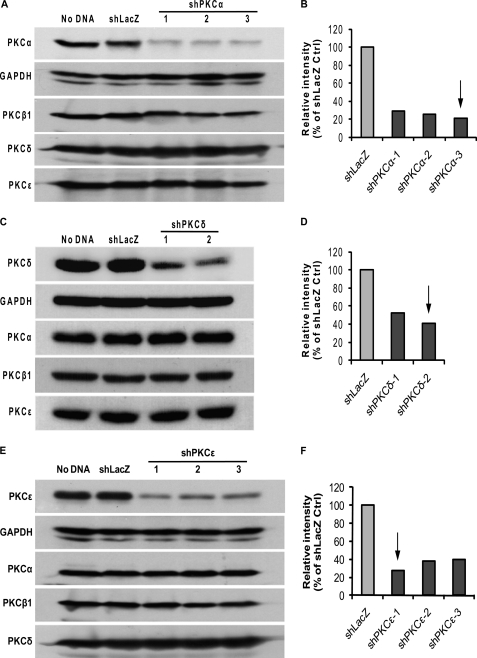
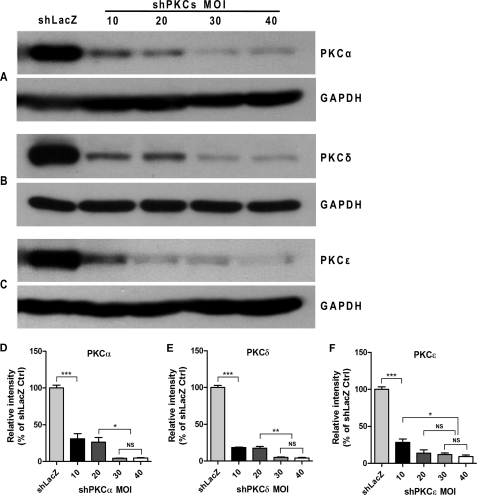
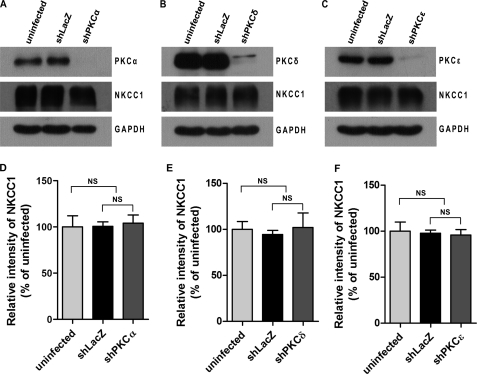
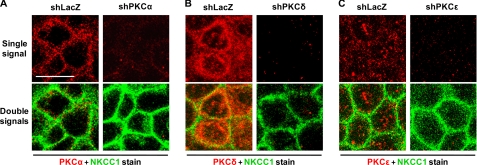
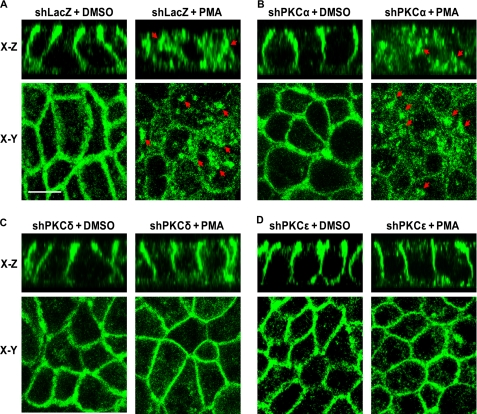
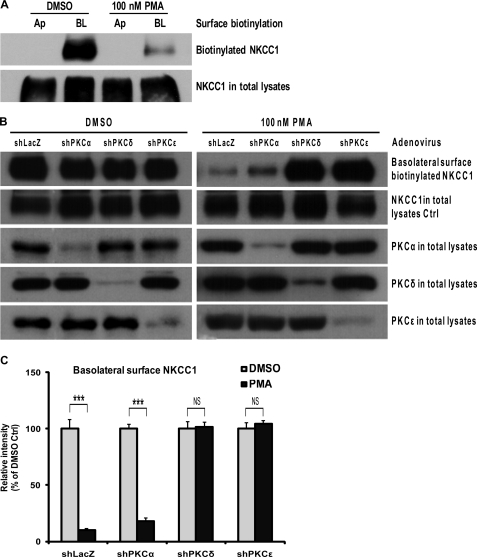
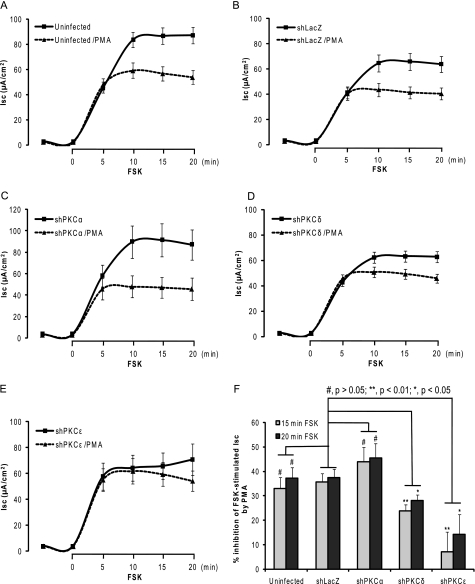
The basolateral Na(+)-K(+)-2Cl(-) cotransporter (NKCC1) is a key determinant of transepithelial chloride secretion and dysregulation of chloride secretion is a common feature of many diseases including secretory diarrhea. We have previously shown that activation of protein kinase C (PKC) markedly reduces transepithelial chloride secretion in human colonic T84 cells, which correlates with both functional inhibition and loss of the NKCC1 surface expression. In the present study, we defined the specific roles of PKC isoforms in regulating epithelial NKCC1 and chloride secretion utilizing adenoviral vectors that express shRNAs targeting human PKC isoforms (α, δ, ε) (shPKCs) or LacZ (shLacZ, non-targeting control). After 72 h of adenoviral transduction, protein levels of the PKC isoforms in shPKCs-T84 cells were decreased by ∼90% compared with the shLacZ-control. Activation of PKCs by phorbol 12-myristate 13-acetate (PMA) caused a redistribution of NKCC1 immunostaining from the basolateral membrane to intracellular vesicles in both shLacZ- and shPKCα-T84 cells, whereas the effect of PMA was not observed in shPKCδ- and shPKCε- cells. These results were further confirmed by basolateral surface biotinylation. Furthermore, activation of PKCs by PMA inhibited cAMP-stimulated chloride secretion in the uninfected, shLacZ- and shPKCα-T84 monolayers, but the inhibitory effect was significantly attenuated in shPKCδ- and shPKCε-T84 monolayers. In conclusion, the activated novel isoforms PKCδ or PKCε, but not the conventional isoform PKCα, inhibits transepithelial chloride secretion through inducing internalization of the basolateral surface NKCC1. Our study reveals that the novel PKC isoform-regulated NKCC1 surface expression plays an important role in the regulation of chloride secretion.


Figures

FIGURE 1.
FIGURE 1.
Screening of shPKC targets in HEK 293A. HEK 293A cells were transfected with pENTRY clone constructs expressing shPKCα, -δ, and -ϵ for 48 h, and cell lysates were then examined for specific PKC knockdown and cross-knockdown with other PKC isoforms by Western blotting. No DNA was a transfection reagent control and shLacZ was set up as a non-targeting shRNA control. GAPDH was used as a loading control for normalization. A, screening blots of three shPKCα targets and cross-knockdown assay for PKCβ1, PKCδ, and PKCϵ. B, relative intensity (% of shLacZ control) of blots shown in A. All the three shPKCα targets decreased PKCα expression by more than 70% without affecting the expression of PKCβ1, -δ, and -ϵ. The arrow points to the shPKCα target giving the highest knockdown efficiency that was chosen to be subcloned into adenoviral vector. C, screening blots of two shPKCδ targets and cross-knockdown assay for PKCα, PKCβ1, and PKCϵ. D, relative intensity (% of shLacZ control) of blots shown in C. The two shPKCδ targets decreased PKCδ expression by ∼50% without affecting the expression of PKCα, -β1, or -ϵ. The arrow points to the shPKCδ target giving the higher knockdown efficiency that was chosen to be subcloned into adenoviral vector. E, screening blots of three shPKCϵ and cross-knockdown assay for PKCα, PKCβ1, and PKCδ. F, relative intensity (% of shLacZ control) of blots shown in E. The three shPKCϵ targets reduced PKCϵ expression by more than 60% without affecting the expression of PKCα, -β1, and -δ. The arrow points to the shPKCϵ target giving the highest knockdown efficiency that was chosen to be subcloned into adenoviral vector. The blots shown are representative of two independent experiments.
FIGURE 2.
FIGURE 2.
Determination of shPKC-adenoviral m.o.i. and PKC knockdown efficiency in T84 destination cells. T84 cell monolayers grown on Transwell supports (24-mm insert diameter) were infected with shLacZ-adenovirus (m.o.i. = 30) serving as non-targeting shRNA control or with shPKCα-, shPKCδ-, and shPKCϵ-adenovirus with increasing m.o.i. ranging from 10 to 40 for 72 h, respectively. The cell lysates were collected and subjected to Western blotting for PKC α, δ, and ϵ proteins. GAPDH protein was probed as a sample loading control. A, PKCα knockdown by shPKCα-adenovirus transduction; B, PKCδ knockdown by shPKCδ-adenovirus transduction; and C, PKCϵ knockdown by shPKCϵ-adenovirus transduction in T84 cells at m.o.i. of 10, 20, 30, and 40. Quantitative analysis of the blot densitometric values from three independent experiments was performed using one-way ANOVA with Tukey's multiple comparison tests after normalized to the values of respective GAPDH blots (D–F). Data are expressed as the percentage of shLacZ control and values represent mean ± S.E. (n = 3). ***, p < 0.001; **, p < 0.01; *, p < 0.05; NS, not significant. As m.o.i. of 30 was the minimum that resulted in ∼90% knockdown of each PKC isoform in T84 cells compared with shLacZ control, we chose it for use in the subsequent experiments.
FIGURE 3.
FIGURE 3.
Effect of PKC isoform-specific knockdown on the expression of total cellular NKCC1 in T84 cells. T84 cell monolayers grown on Transwell supports (24-mm insert diameter) were uninfected or infected with non-targeting shLacZ-adenovirus or shPKCα-, shPKCδ-, and shPKCϵ-adenoviruses (m.o.i. = 30) for 72 h. The cell lysates were probed for proteins of PKC isoforms, NKCC1, and GAPDH by Western blotting. A, effect of PKCα knockdown on total NKCC1 protein expression in T84 cells. The top blot shows the expression levels of PKCα protein, the middle blot shows the expression levels of total NKCC1 protein, and the lower blot indicates the expression of GAPDH serving as sample loading control. B, effect of PKCδ knockdown on total NKCC1 protein expression in T84 cells. The top blot shows the expression levels of PKCδ protein. C, effect of PKCϵ knockdown on total NKCC1 protein expression in T84 cells. The top blot shows the expression levels of PKCϵ protein. The blots shown are representative of three separate experiments. Quantitation of three blots from triplicate experiments was conducted by densitometry and data were analyzed using one-way ANOVA with Tukey's multiple comparison tests after normalized to the respective GAPDH blots (D–F). Data are presented as the percentage of uninfected cells (mean ± S.E., n = 3). NS, not significant.
FIGURE 4.
FIGURE 4.
Effect of PKC knockdown on distribution of NKCC1 in T84 cells. T84 cell monolayers grown to confluence on Transwell supports (6.5-mm insert diameter) were infected with shLacZ-, shPKCα-, shPKCδ-, or shPKCϵ-adenovirus (m.o.i. = 30) for 72 h. The cells were fixed in methanol and dually stained using mouse anti-NKCC1 primary antibody T4 (labeled with Alexa Fluor 488 goat anti-mouse secondary antibody, green) and rabbit anti-PKCα, -δ, or -ϵ (labeled with Alexa Fluor 555 goat anti-rabbit secondary antibody, red). The images of the cells were captured by confocal microscopy. The upper panels display staining signal of individual PKC isoforms (red) and the lower panels represent the PKC staining signal (red) merged with NKCC1 staining signal (green). A, knockdown of PKCα in shPKCα-T84 monolayers. Staining signals for PKCα and NKCC1 are shown in both shLacZ- and shPKCα- cells. B, knockdown of PKCδ in shPKCδ-T84 monolayers. Staining signals for PKCδ and NKCC1 are shown in both shLacZ- and shPKCδ- cells. C, knockdown of PKCϵ in shPKCϵ-T84 monolayers. Staining signals for PKCϵ and NKCC1 are shown in both shLacZ- and shPKCϵ- cells. Scale bar, 10 μm.
FIGURE 5.
FIGURE 5.
PKCδ or PKCϵ knockdown prevents NKCC1 internalization during PMA exposure. T84 cell monolayers grown to confluence on Transwell supports (6.5-mm insert diameter) were infected with shLacZ-, shPKCα-, shPKCδ-, or shPKCϵ-adenovirus (m.o.i. = 30) for 72 h. The cells were then exposed to vehicle (DMSO) or 100 nm PMA for 1 h. Subsequently, the cells were fixed in methanol, stained, and visualized by confocal microscopy. A, NKCC1 distribution detected by immunofluorescence with Alexa Fluor-488 (green) in shLacZ- cells treated with DMSO (left panel) or 100 nm PMA (right panel). The upper two panels represent X-Z sections and the lower two panels represent X-Y sections. B, same as A except the cells were transduced with shPKCα-adenovirus. C, same as A except the cells were transduced with shPKCδ-adenovirus. D, same as A except the cells were transduced with shPKCϵ-adenovirus. Scale bar, 10 μm.
FIGURE 6.
FIGURE 6.
Surface biotinylation assay for the membrane surface NKCC1 expression. T84 cell monolayers were grown to confluence on Transwell supports (24-mm insert diameter). A, cells were treated with vehicle (DMSO) or 100 nm PMA for 1 h, and then cell surface biotinylation assays were performed at either the apical (Ap) or basolateral side (BL) of Transwell supports and the cell lysates were subjected to Western blotting using primary mouse anti-NKCC1 T4 antibody. Shown are representative blots of three independent experiments. B, cells were infected with non-targeting shLacZ-adenovirus and with shPKCα-, shPKCδ-, or shPKCϵ-adenovirus (m.o.i. = 30) for 72 h before treatment with vehicle (DMSO, left panel) or 100 nm PMA (right panel) for 1 h. The basolateral surface biotinylation assay was then conducted and the cell lysates were analyzed by Western blotting. The first row blots from the top represent the dynamic change of biotinylated NKCC1 protein after PMA or DMSO treatment in the four groups of shLacZ-, shPKCα-, shPKCδ-, and shPKCϵ- cells. The second row blots show the total NKCC1 protein expression. The third, fourth, and fifth row blots indicate the expression levels of PKCα, PKCδ, and PKCϵ, respectively, in the total cell lysates. The blots shown are representative of three independent experiments. C, blot bands of basolateral surface biotinylated NKCC1 were quantified by densitometry, and data from the three experiments were analyzed with unpaired t test after normalization to respective NKCC1 in total lysates. The data are presented as the percentage of DMSO control (mean ± S.E., n = 3). ***, p < 0.001; NS, not significant.
FIGURE 7.
FIGURE 7.
Impact of PKC isoform-specific knockdown on PMA inhibition of cAMP-stimulated Isc. T84 cell monolayers grown to confluence on Transwell supports (6.5-mm insert diameter) were uninfected or infected with shLacZ-, shPKCα-, shPKCδ-, or shPKCϵ-adenovirus (m.o.i. = 30) for 72 h, respectively. The procedure for Isc measurement was carried out as described under “Experimental Procedures.” The cells of each group were exposed to vehicle (solid line) or 100 nm PMA (dashed line) for 1 h and then exposed to 10 μm forskolin (FSK). The Isc (μA/cm2) was measured every 5 min before and after FSK exposure. The data shown here were obtained from uninfected control cells (A), non-targeting shLacZ-adenovirus transduced cells (B), shPKCα-adenovirus transduced cells (C), shPKCδ-adenovirus transduced cells (D), and shPKCϵ-adenovirus transduced cells (E), respectively. F, summary of % inhibition of FSK-stimulated Isc by PMA at 15 and 20 min FSK exposure. The data are presented as mean ± S.E. % of inhibition of Isc by PMA.

Similar articles

Cited by

References

    1. Russell J. M. (2000) Physiol. Rev. 80, 211–276 - PubMed
    1. Haas M., Forbush B., 3rd (2000) Annu. Rev. Physiol. 62, 515–534 - PubMed
    1. Lebenthal E., Duffey M. E. (1990) Textbook of Secretory Diarrhea, Raven Press, New York
    1. Halm D. R., Raymond F. A. (1990) in Textbook of Secretory Diarrhea (Lebenthal E., Duffey M. E. eds) pp. 47–58, Raven Press, New York
    1. Matthews J. B. (2002) World J. Surg. 26, 826–830 - PubMed

Publication types